Wall Street’s Correction
9 February 2018
By PDSNET
The Bigger Fool” on 29-1-18. So now the correction is happening, what will it look like?
Well most probably it will not go down too far and it will not stay down there too long. The last correction began in July 2015 and ended in February 2016 – 7 months – and it reached 14%. Because the S&P was well above its upper channel line, this correction could be similar – except that we do not expect it to last as long. We believe that it will be short and sharp.
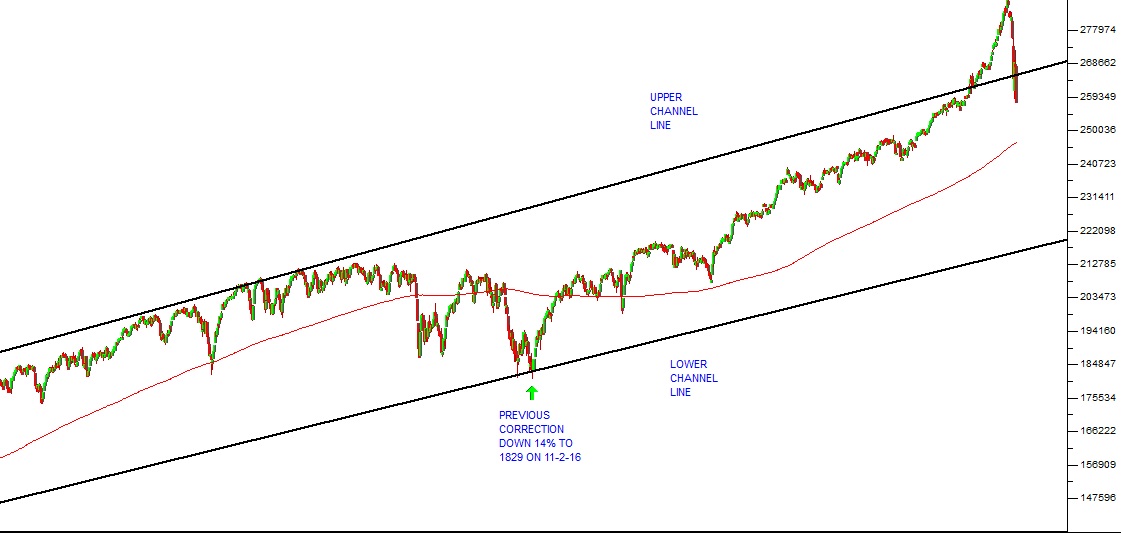
S&P500 Index February 2014 to February 2018 - Chart by ShareFriend Pro
From a fundamental perspective, much of the rise in the S&P has been because of the growing optimism about the US economy. That economy is growing at an incredible rate now – and it is a huge economy (more than twice as big as the next biggest economy in the world). The growth in the US economy is going to continue – and even accelerate. So we think that as the positive economic statistics come through they will shift the sentiment on Wall Street back to positive.
Indeed one of the causes of the current correction is that traders have been spooked by the exceptional growth in the US economy – which they believe will result in the Federal Reserve Bank raising interest rates much more quickly. It is one of the great ironies of Wall Street that very good news about the economy can cause the market to fall because of the fear of interest rate hikes.
So our view is that this is definitely a correction and not the start of a new bear trend. As positive news flows through from the US economy, the market will recover. What has happened is that some of the “irrational exuberance” has gone out of the market. Investors will be more cautious for a while. But we believe that this is a healthy and inevitable correction which will return some sanity to the underlying bull trend.