Choosing Winning Shares
20 November 2017 By PDSNET
And, of course, we are making the assumption that you will always have in place a strict stop-loss strategy, which you will implement as soon as a purchase drops below that key level.
So, let us drill down through this idea to see what we can discover.
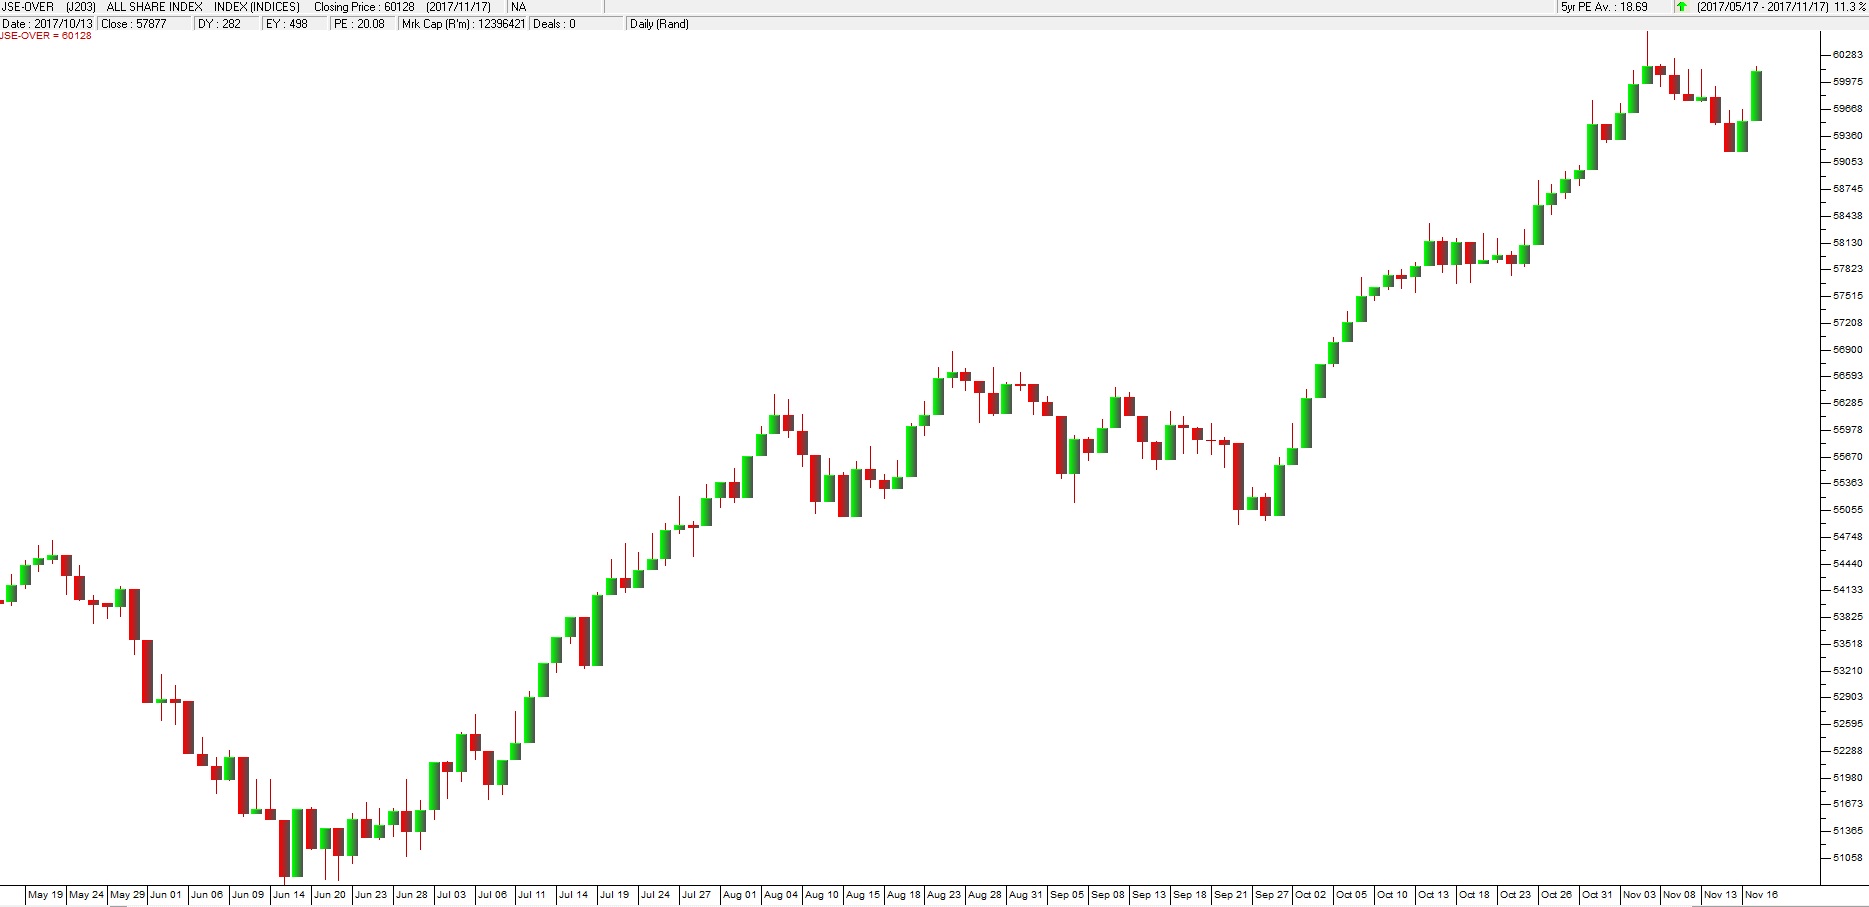
Clearly our market is rising – following Wall Street up, making new record highs, as it anticipates the coming economic boom. This can be seen by considering the JSE overall index:

JSE Overall Index - Chart by ShareFriend Pro
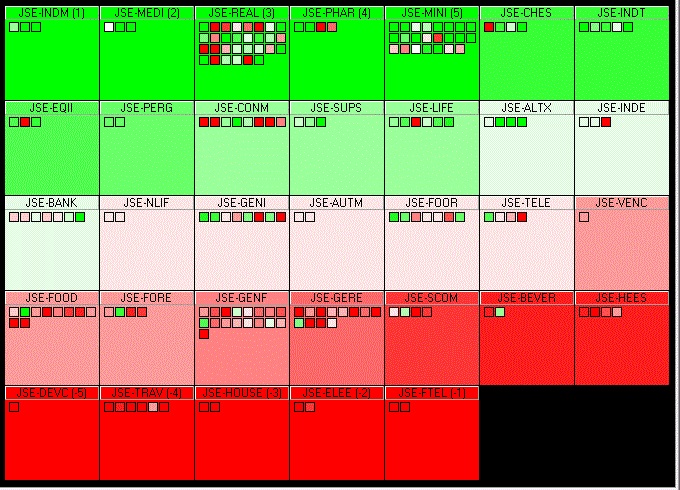
But not every sector is rising within that index. To discover which specific sectors are moving, let us consider the “Market Carpets” feature of the ShareFriend Pro software (under “Scans” menu at the top of your software). If we set this unique tool to do a 3-month scan of the sectors we get a diagram like this:
ShareFriend Pro Market Carpets
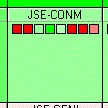
What this shows us that over the past three months, the best sector has been the Steel and other Metals (JSE-INDM), followed by Media (JSE-MEDI). The worst sector was the Fixed Line Telecommunications sector (JSE-FTEL) followed by the Electronic and Electrical Equipment sector (JSE-ELEE). Now clearly, you will note that the Steel and other Metals index is being driven by the performance of Kumba, while the Media sector is dominated by Naspers (with its 34% stake in the Chinese company, Tencent). So, both of these winners are being pushed by the relative weakness of the rand against hard currencies. But they are also being driven by the strong recovery in the iron price and the exceptional results of social media platform, Tencent, in China. Of these two results, the one that we favour is Naspers simply because it is not being pushed by a commodity – like Kumba. The price of iron could enter a downward trend at any moment (and probably will, considering the rising supply on world markets), while social media usage is likely to continue to expand rapidly in China. Both are well-managed, both are rand-hedges and both could well go higher, but the one appears to us to be less risky. Each sector in the Market Carpet is denoted by a square – and inside that square are small squares which represent the individual companies in that sector. Consider the example of the Construction and Materials index (JSE-CONM):