Vodacom
6 October 2017 By PDSNET
Vodacom has always been relatively poorly rated compared to other blue chips on the JSE. It consistently trades at a dividend yield of between 4,5% and 5%, probably because its business depends heavily on new technologies and it is well-known that revenues from voice are declining while revenues from data are increasing.
Right now, however, the share is in a very interesting position. It is on its [glossary_exclude]long[/glossary_exclude]-term upward trendline. Consider the chart:
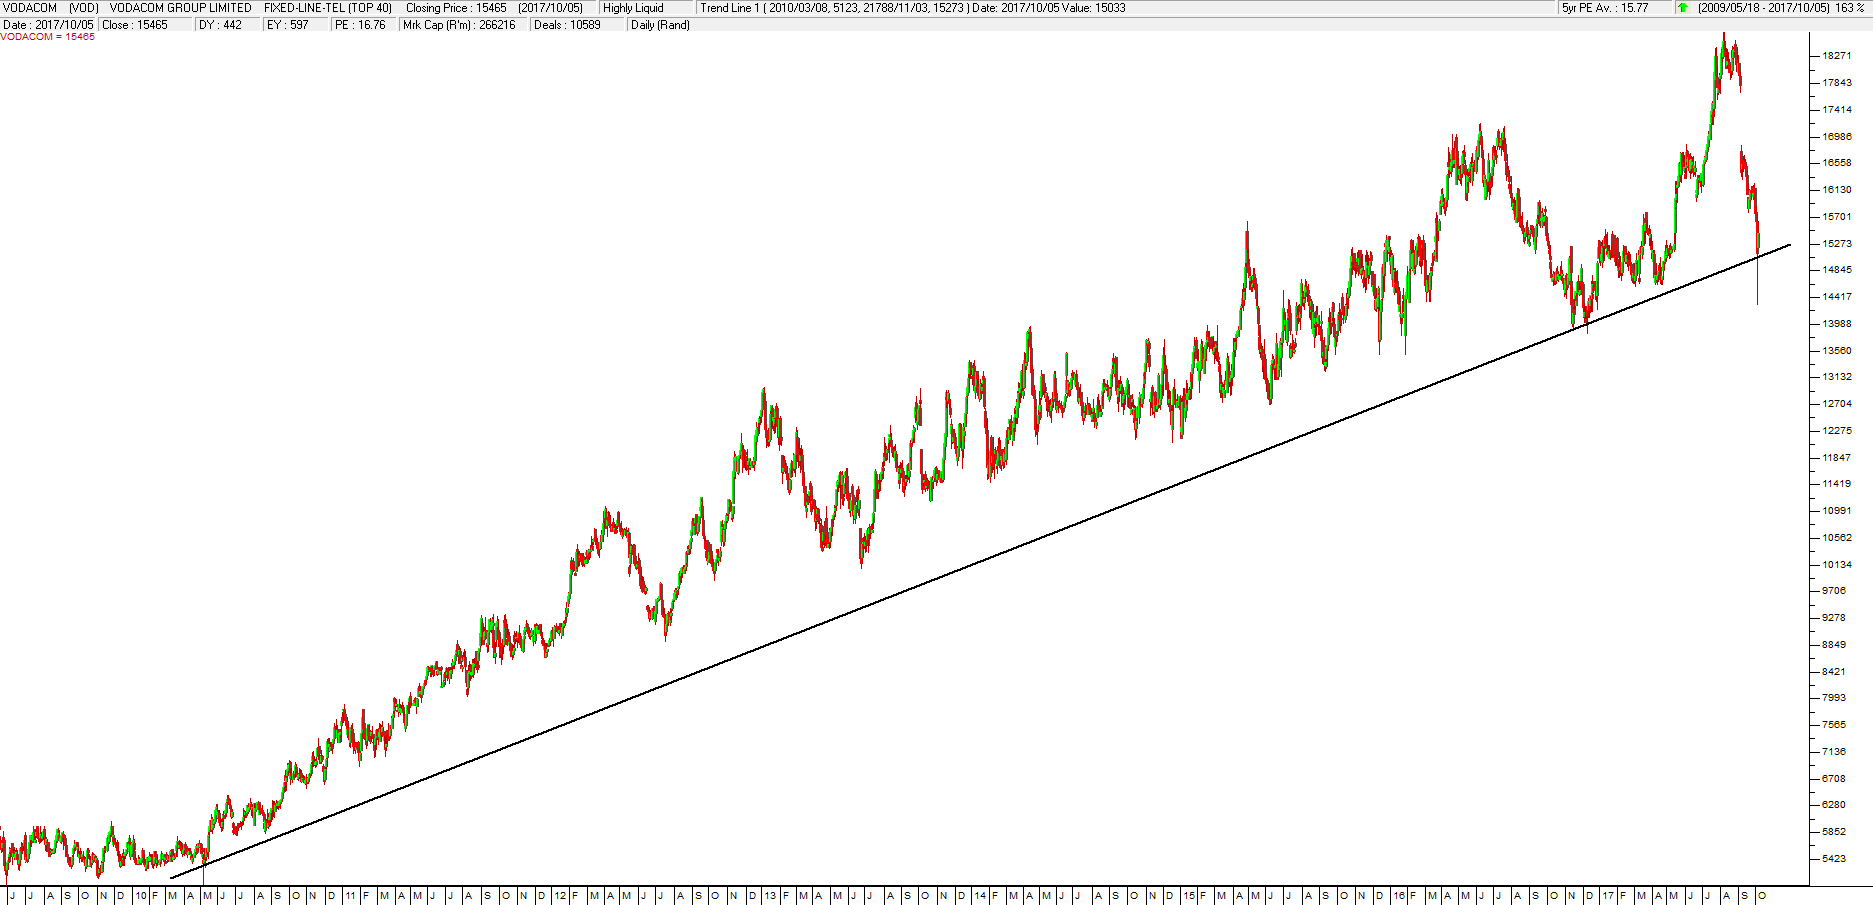
Vodacom Group (VOD) - Chart by ShareFriend Pro
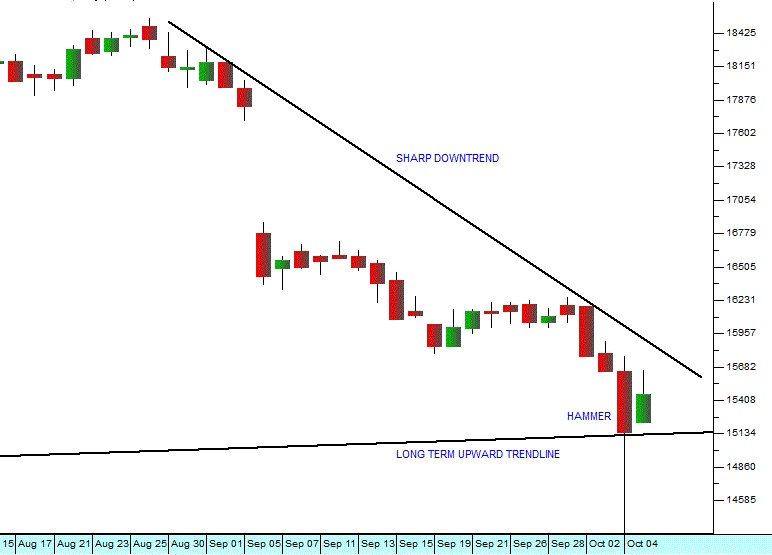
This trendline has three touch points already and the bounce off that line which happened yesterday makes a fourth. The more touch [glossary_exclude]points[/glossary_exclude] that a trendline connects, the more reliable it becomes. More importantly, on 4th October 2017 it produced a classical hammer formation – indicating a cycle low point. The hammer formation in candlestick charting occurs where a candle has a “tail” which is at least twice as [glossary_exclude]long[/glossary_exclude] as the body of the candle. It must also come at the end of a notable downtrend. Hammer formations show that the bears made a very serious attempt to push the share down through key support (the [glossary_exclude]long[/glossary_exclude]-term upward trendline) but failed. A hammer formation requires that the tail is twice as [glossary_exclude]long[/glossary_exclude] as the body of the candle. Consider the chart of the last three months: