Horizontal Count on Afrimat
29 May 2019 By PDSNETth April 2019) it announced that it had put in a firm offer to buy Universal Coal Plc., a company listed in Australia but which has operations in South Africa. Afrimat has offered R2,1bn for the business which mainly supplies coal to Eskom through contracts valid until 2023.
But from a private investor’s point of view, what makes Afrimat really interesting is its extended sideways market going back to mid-October 2016.
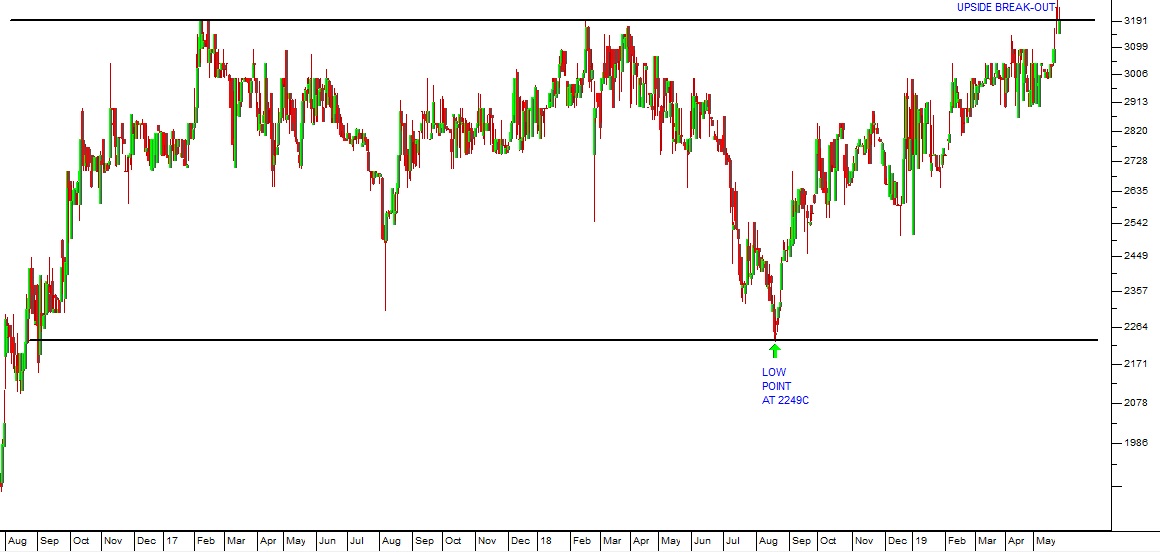
Afrimat (AFT) August 2016 to May 2019 - Chart by ShareFriend Pro
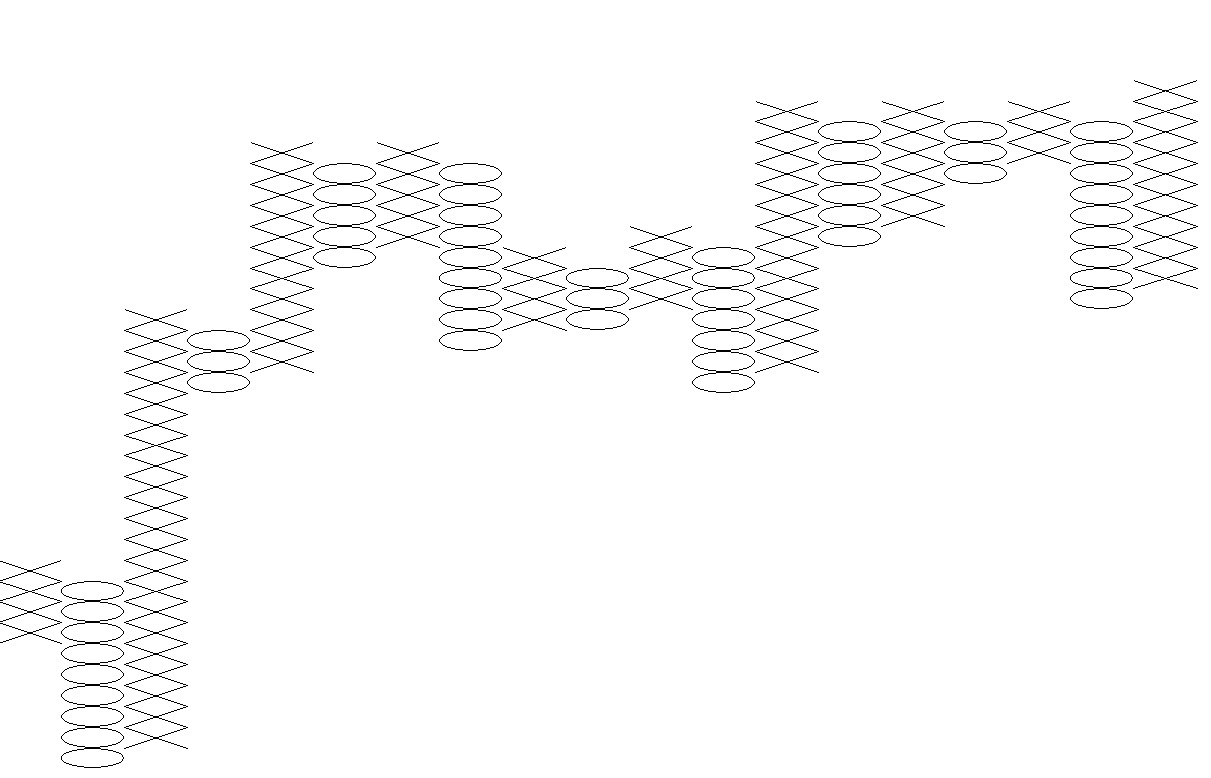
Here you can see a conventional candlestick chart with the extended sideways market defined by upper and lower horizontal lines. The upside break-out is visible in the top right-hand corner. You can also see the low point of the sideways market which occurred at 2249c on 21st August 2018. In a normal market, businesses strive to grow and their share prices reflect that growth over time. But sometimes, when that growth is not reflected in the share price for an extended period because of market uncertainty (as in the case of Afrimat), it results in a build-up of value which is not reflected in the share’s price. Once an upside breakout is achieved from that sideways market there is often a sharp rally. The technique of a horizontal count in Point and Figure charting allows us to measure the upward potential of a break from a sideways market. Point and Figure charting is a very old charting method which strives to exploit the changes in direction of a share’s price. To do this a one-dimensional chart is constructed which measures price on the Y-axis, but does not measure time on the Y-axis. Instead, it measures changes in direction. The following is a point and figure chart taken from Metastock which shows the sideways pattern in Afrimat for the same time period as the chart given above with the upside breakout which happened yesterday.