S&P500 over 2600
27 November 2017
By PDSNET

S&P500 Index June 2017 to November 2017 - Chart by ShareFriend Pro
(click to enlarge image)
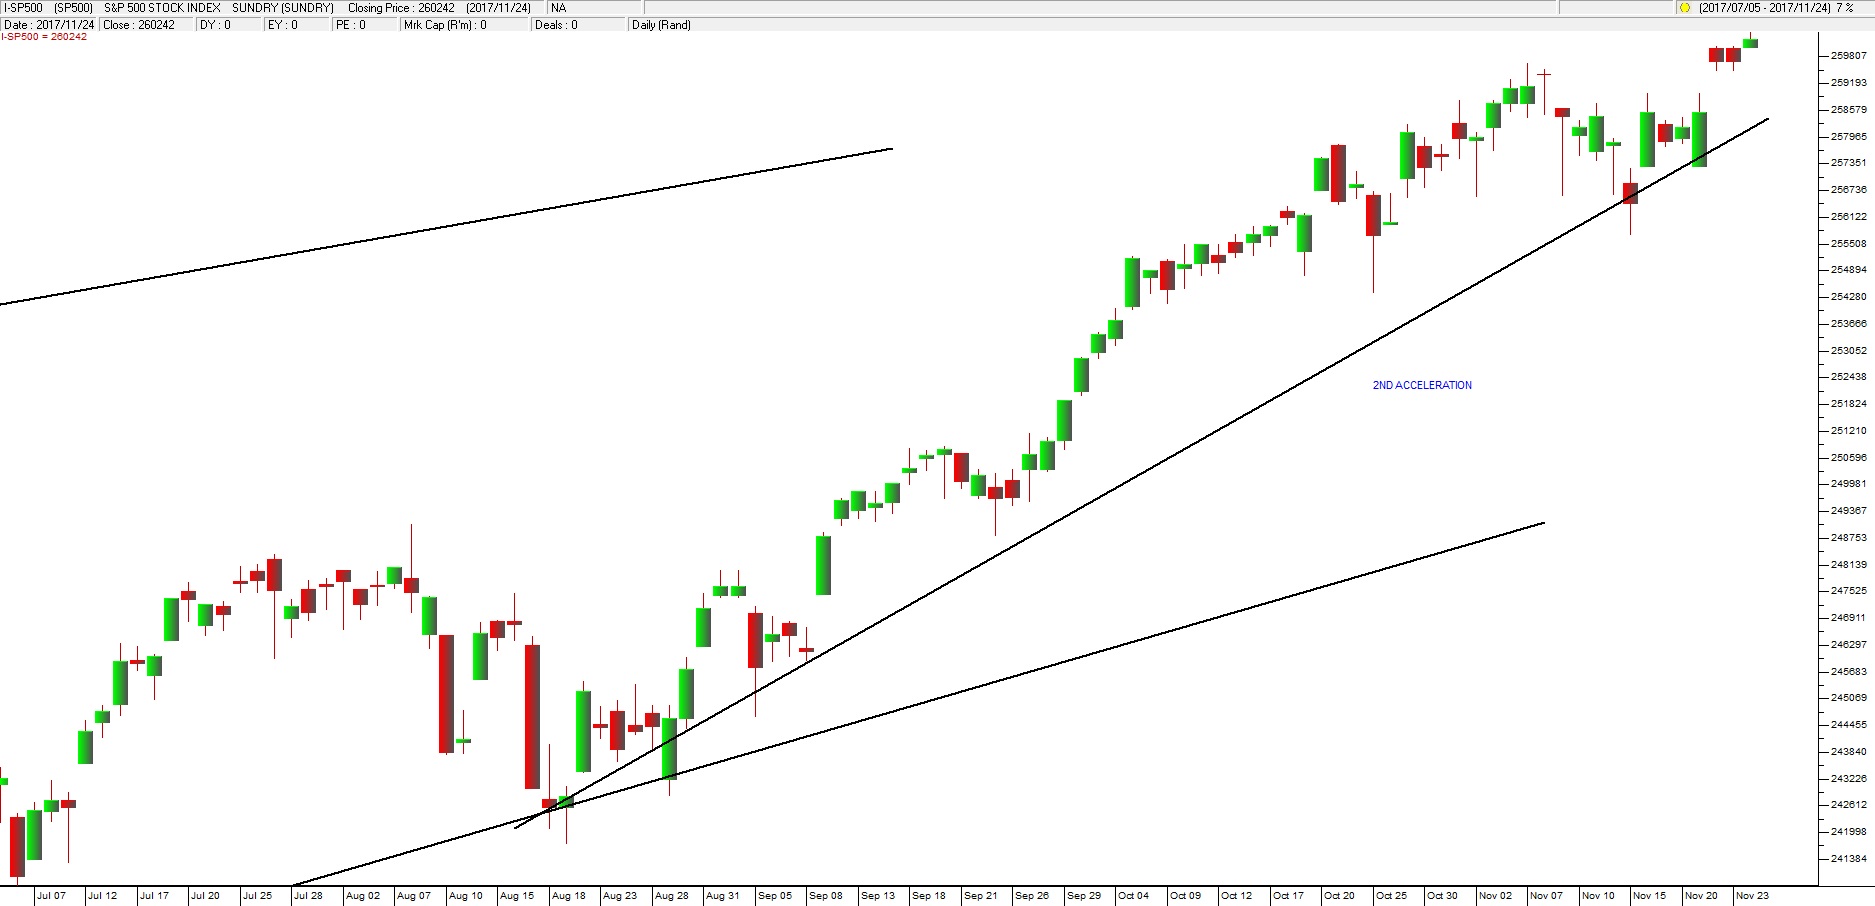
This chart shows the S&P over the past 5 months. The diagonal line across the top left-hand corner is the long-term upper channel line which we will consider in more detail below. As you can see the trend has accelerated since mid-August in what we describe as the “2
nd acceleration”. The meaning of this becomes clear in the second chart below:

S&P500 Index July 2016 to November 2017 - Chart by ShareFriend Pro
(click to enlarge image)
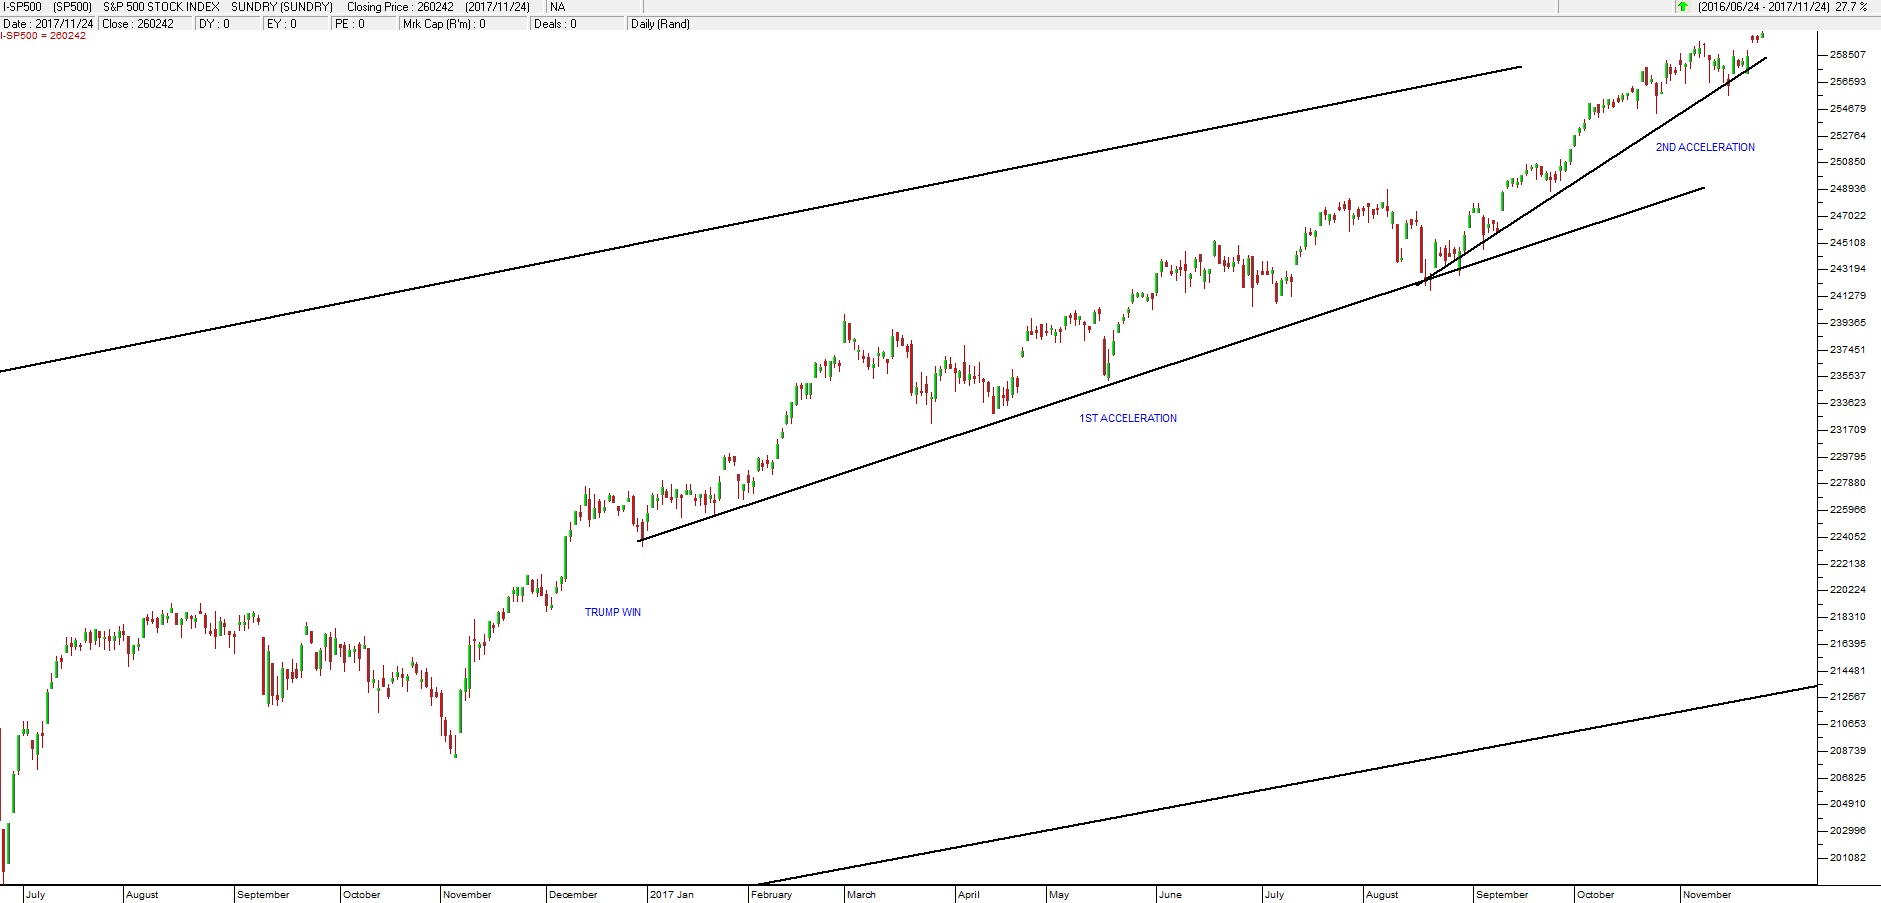
Here you can see the S&P over the past 22 months, since the second correction on 11-2-2016. Now the first acceleration which began in December 2016 becomes clear and it is possible to see the upper and lower long-term channel lines. We have also marked the win by Trump in November 2016. Finally, let us consider a chart of the entire bull trend since its commencement nearly a decade ago:

S&P500 Index 2008 to 2017 - Chart by ShareFriend Pro
(click to enlarge image)
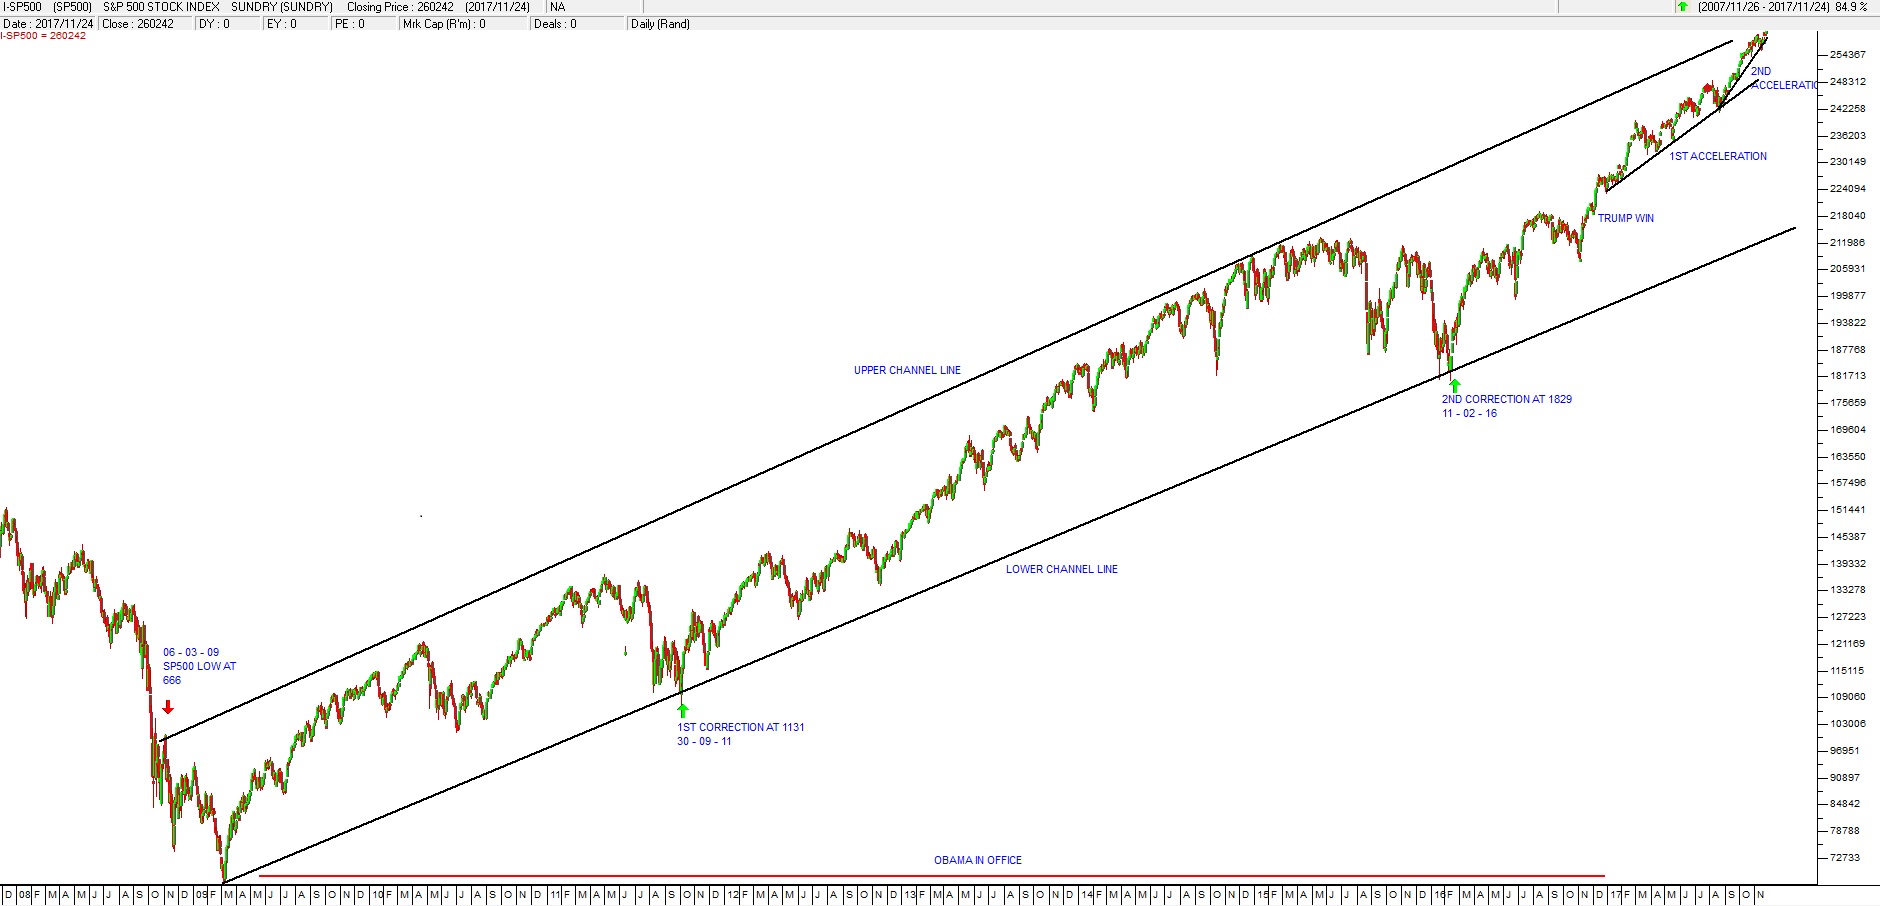
Now you can see the full context of the bull trend from its inception. It has been moving between clear upper and lower channel lines. You can see the two major corrections on 30-9-2011 and then again on 11-2-2016. At the bottom of the chart we have included a horizontal line (in red) that shows Obama’s term of office and that indicates that this bull trend has little or nothing to do with Trump and his proposed tax reforms.
The bull trend has been driven by three primary causes:
- The drop in energy prices since the middle of 2014 when the oil price collapsed. The decline in energy prices will almost certainly continue as renewable energy becomes more and more ubiquitous. We expect energy prices to ultimately fall substantially further over the next two decades.
- The massive amount of quantitative easing (printing of money) which accompanied the sub-prime crisis. It is estimated that a total of around $12,5 trillion was injected into the world economy and Europe is still printing and injecting 60 billion euros a month into the economy. All that money which has been sloshing around in the world’s financial system is now starting to be spent. As more and more money is spent it will drive markets even higher.
- The enormous efficiencies which are flowing from all the new disruptive technologies that are rapidly becoming part of the world economy. These efficiencies are driving a massive and sustained rise in productivity which is reflected in increased profits for all companies. The strong growth in the profits of the S&P500 companies is evidence of this and is pushing share prices up.
What is important is to understand that this bull trend is different from other bull trends since World War II in that it will almost certainly be exponential. It has already lasted for an inordinately long period of time and our belief is that it is far from over. In our opinion, we are in that part of the exponential chart where it turns from being more-or-less horizontal to being more-or-less vertical. At the moment there is still some connection between share prices and the profits of the underlying companies. As we enter the vertical part of this market that connection will be lost. The two recent accelerations which we have identified show that the rise is now gaining momentum. In time, investment experts and economists will become afraid to predict the top of this market. The bears, who are already hesitant, will be completely eliminated. We are seeing predictions for the S&P above 3000 and our view is that the S&P will go much higher in time.
It is interesting to compare this bull market with that of the early 1900’s leading up to the stock market crash of 1929. That too was driven by two important new technologies – the mass-production of the motor vehicle and the spread of the telephone. The current situation is not dissimilar. Technologies from self-driving cars to rapidly improving photo-voltaics and the rapid spread of smart phones and high-speed internet are driving the world economy. The difference is the massive amount of new cash which has been injected into the world economy since 2008. That will provide the liquidity necessary for the economy to enter an unprecedented boom.


