Sasol: Resistance Becomes Support
23 July 2018 By PDSNETan article in which we drew your attention to the fact that Sasol, following its precipitous fall in 2014, had entered a sideways market bounded by support at R360 and resistance at R492. In September 2016, we suggested in another article that:
“It now looks, technically, as though the Sasol share price should move back up towards resistance at around R490”
And that is what happened – but only this year. Not only did the share reach that level (R492) but it broke above it giving a clear technical buy signal.
So what happens next? Well, in technical analysis, once a well-established resistance line like this is broken, it then usually becomes a support line. Typically the share’s price, having broken convincingly above the resistance, comes back to find that exact same level and bounces off it. Consider the chart:
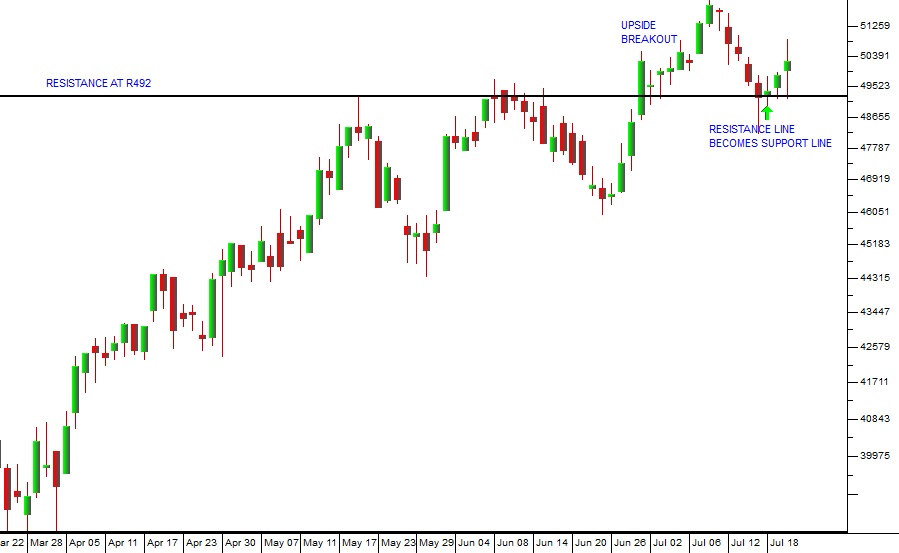
Sasol (SOL) March 2018 to July 2018 - Chart by ShareFriend Pro
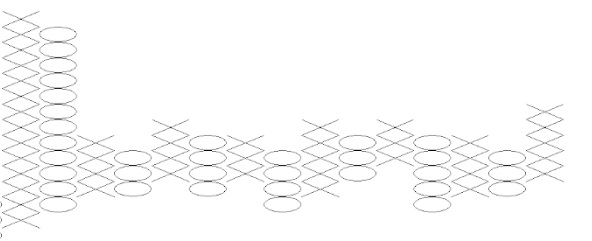
Here you can see how the share broke above R492 reaching as high as R521 before falling back to R492 and bouncing off that level. Of course, the Sasol story is about the recovery of the oil price since the beginning of 2016. It is also important, however, that Sasol has moved away from oil and should begin commissioning its ethane cracker plant in the US later this year. The shift towards more chemicals is likely to see the share re-rated further. A point-and-figure horizontal count suggests that Sasol could go as high as R1257. Consider the chart: