JSE Overall Index versus S&P 500 Index
11 July 2022 By PDSNETThe comparative relative strength index (CRSI) is a very useful indicator. It simply divides one data stream in your software by another and then draws a chart of the result. This enables you to compare the growth in the two data streams against each other graphically.
Consider the chart:

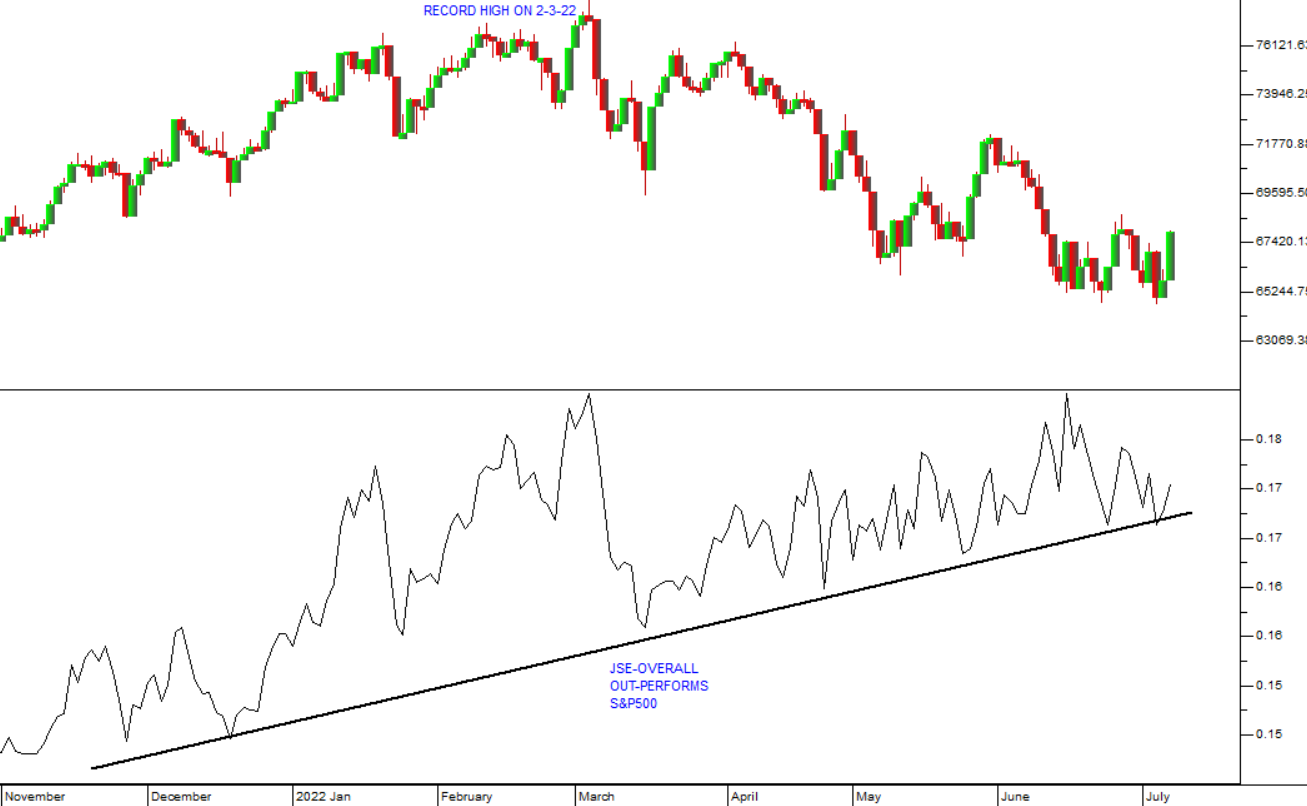
The top half of this chart is a candlestick of the JSE Overall index, showing its record high at 77536 on 2nd March 2022. The chart in the lower half of the screen is calculated by dividing the JSE Overall index by the S&P500 index from Wall Street. As you can see, the lower chart shows that the JSE Overall index has been outperforming the S&P500 index since December last year.
South African investors have been drawn to the fact that the downward trend on the JSE Overall index began three months later than the downtrend on the S&P500 and the fact that the JSE Overall index has only fallen by 16,16% so far compared to the S&P500 index from Wall Street which has fallen by as much as 23,55%. In fact, strictly, based on this, the JSE has not yet entered a bear trend – which is defined as a fall of at least 20%.
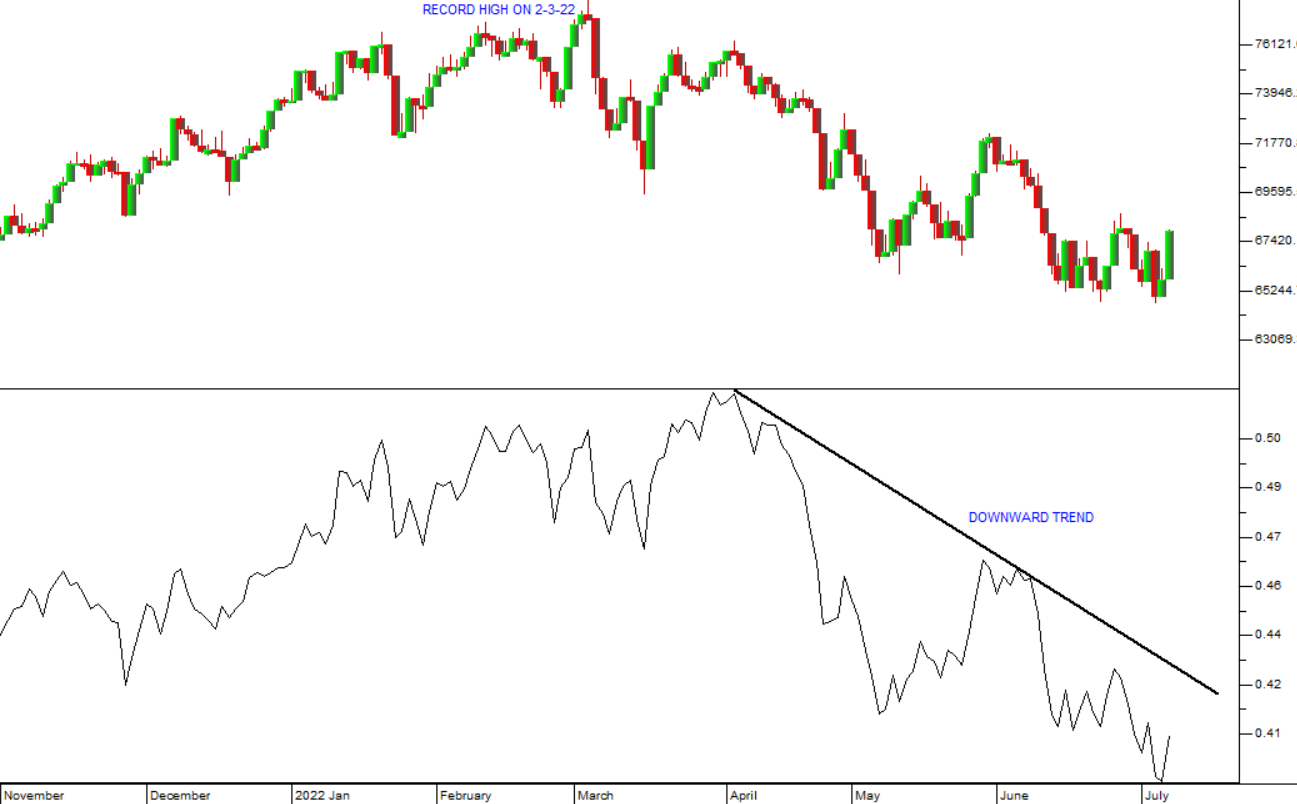
What this analysis leaves out is the rand/dollar exchange rate. If you again use the CRSI to divide the JSE Overall index by the rand dollar exchange rate, you will see that, in US dollars, the JSE Overall index has actually fallen by about 22%. Consider the chart:

Here you can see that, in US dollars, the JSE Overall index peaked on 4th April 2022 and had fallen by 25% by 6th July 2022 – taking it comfortably into bear market territory. And this is because during that time the rand fell from R14.58 to R16.82 to the US dollar.
This analysis shows the usefulness of the CRSI indicator in your software. You can find the CRSI among the indicators listed at the bottom of your screen below the chart. To get a better explanation of the CRSI go to our lecture module 26.