Capitec Revisited
21 November 2018 By PDSNETth February 2018, about two weeks after the Viceroy report on Capitec that took the share price down 25%, we published an article in which we suggested that Capitec was in fact very cheap, because its Price:Earnings Growth ratio (PEG) was at just 0,63. At the time, Capitec was trading for around R820 per share.
The PEG ratio can be easily calculated by dividing a company’s P:E ratio by its average growth in headline earnings per share (HEPS). All the required numbers are in the ShareFriend Pro software. The HEPS is given in the comment feature for each listed share and the P:E ratio is quoted with other price-related data at the top of your screen above the chart.
The PEG ratio tells us whether a share’s price is out of kilter with its profit history. If a company is producing good profits on a regular basis and those profits are rising year after year, then its share should be highly-rated and trading for a high P:E ratio – and vice versa. The PEG ratio gives a mechanism which we can use to compare companies in the same industry to establish whether they are under- or over-priced in relation to their earnings history. A PEG ratio below 1 indicates that the share is relatively cheap while anything above 1 is expensive.
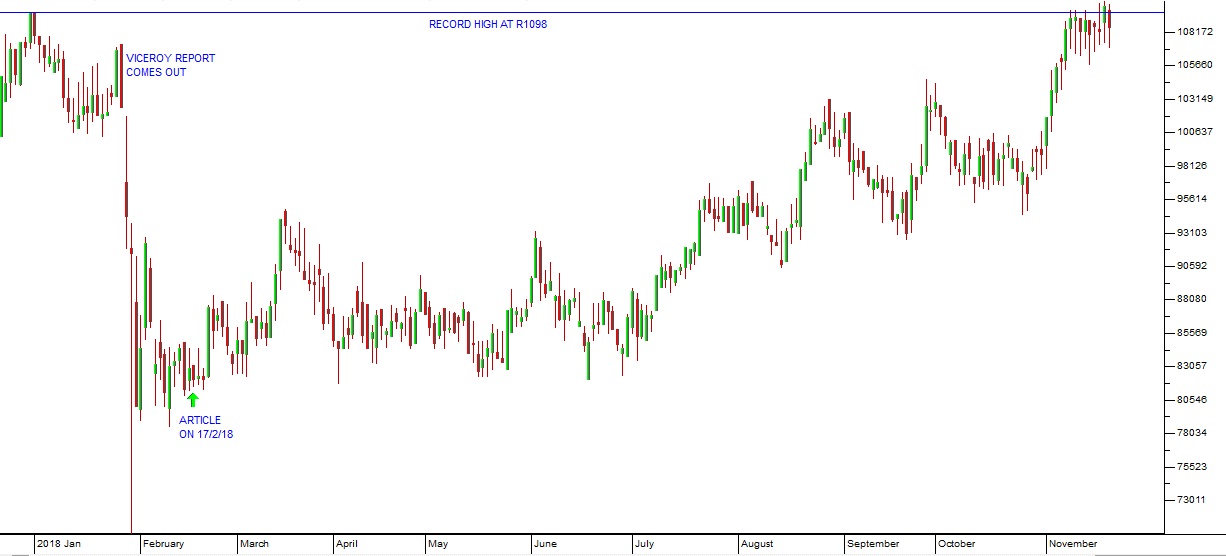
In our article on 19th February 2018, we compared Capitec’s PEG of 0,63 to Standard Bank’s PEG at the time of 1,44 and FNB’s PEG of 1,34 – and we suggested that this made Capitec a good buy at around R820. Consider the chart: