Using Market Carpets
9 April 2018 By PDSNETShareFriend Pro software has an excellent feature that gives you a clear overview of the performance of the various sectors in the market. We call it a “Market Carpet”. To find it you must click on “Scans” at the top of your screen roughly in the middle. Then select “Market Carpets”. There will then appear on your screen a table of the 32 sectors of the market and their price performance over the last trading day.
You need to click on the drop-down which allows you to change the period of time and change it to 2 years. The carpet will then recalculate to show you how the various sectors have performed over the past two years. It should look like this:
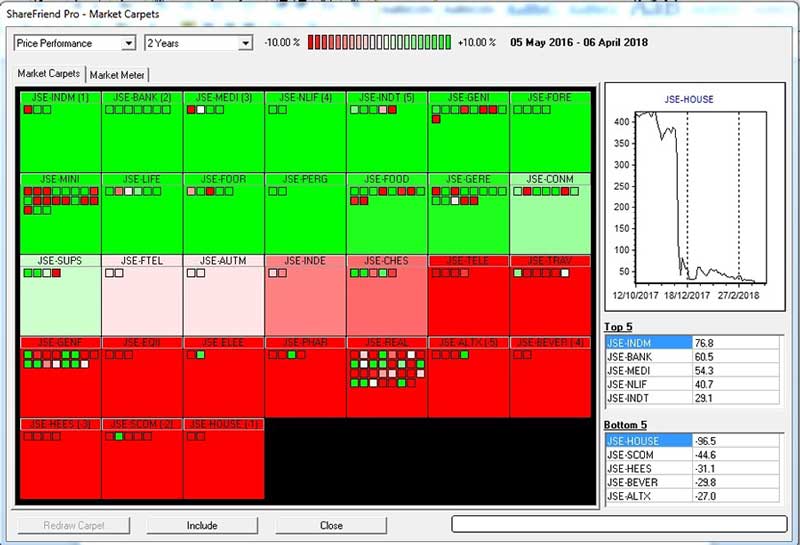
Market Carpets Scanning Features
The sectors are arranged in order of their price performance with the best performer in the top left-hand corner and the worst in the bottom right-hand corner. Put your mouse over the second best sector (JSE-BANK) and you will see that over the last two years the banks were one of the very best investments on the JSE. In fact, in 2016 the banks appreciated by 26% and in 2017 they managed 24%. That was against a background of Nene and Gordhan being fired as finance minister and then the subsequent ratings downgrades. But how could you have known that banks were a good investment in April 2016? Consider the chart of the JSE banking index: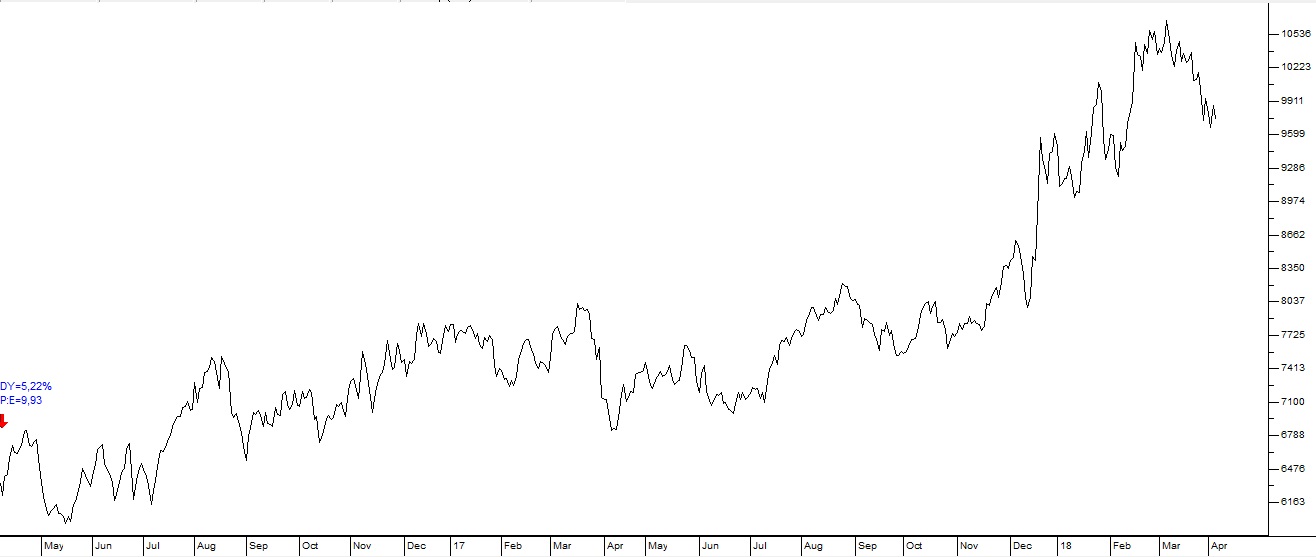
JSE Banking Sector April 2016 to April 2018 - Chart by ShareFriend Pro
Here you can see that in April 2016 the JSE banking index was trading on a P:E ratio of less than 10 and a dividend yield of 5,22%. Any quality share which is trading on a dividend yield of 5% or more is probably a good buy and certainly worth your attention. So what we are suggesting is that the Market Carpets feature of your ShareFriend is a very good way to find interesting shares which may represent a good opportunity. If you look at the two-year carpet above you will see that each sector square has a number of smaller boxes inside it. These represent the individual shares. Thus the banking sector square looks like this: