Support on the S&P
6 April 2018 By PDSNETth January and the low of 2581 on 8th February. Consider the chart:
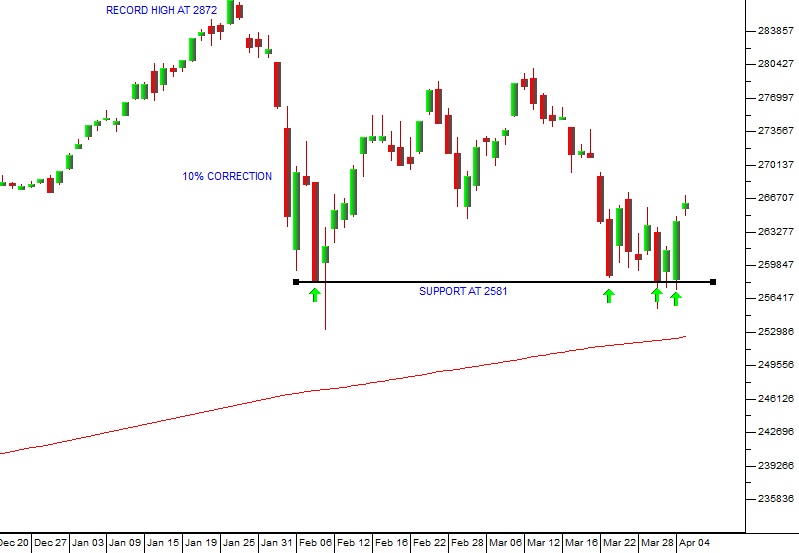
S&P500 Index December 2017 to April 2018 - Chart by ShareFriend Pro
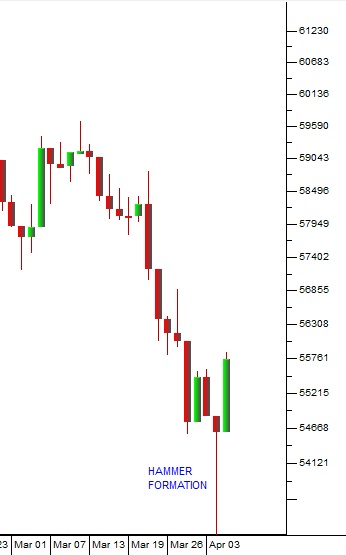
Since then the index has been moving sideways, but on Friday two weeks ago it came down to test support at that low (2581). Then, this week, that low was tested again on Monday and Wednesday (the green arrows). On both occasions, the S&P came back to the 2581 level and bounced. Last night, encouraged by the repeated failure of the bears to get the S&P to close below 2581, the market rallied strongly. So what we now have is a “quadruple bottom” at about 2581 – and that makes it far less likely that that level will be broken. Of course, there are no certainties in the markets, but it now appears reasonably sure that Wall Street will go up to attempt to break above the previous record high made on 26th January 2018. The impact on our blue chips of these repeated attempts of the S&P to break below the support at 2581 was obvious, especially this week when Capitec fell back to R817, making a clear “hammer formation" at that level. This was echoed in the JSE Overall index which also made a “hammer” on Wednesday this week: