Volatility
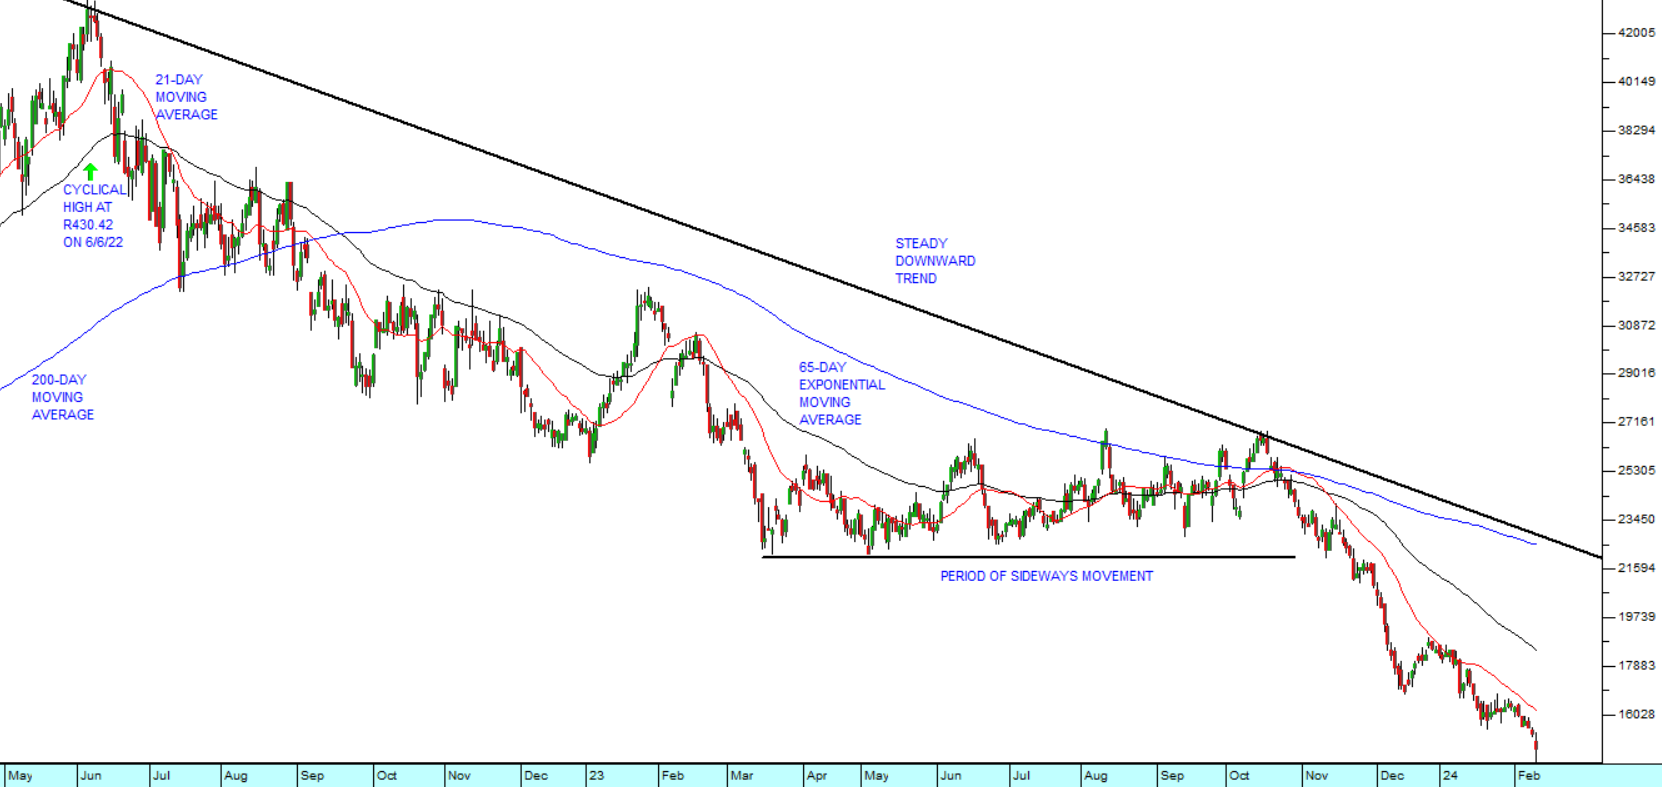
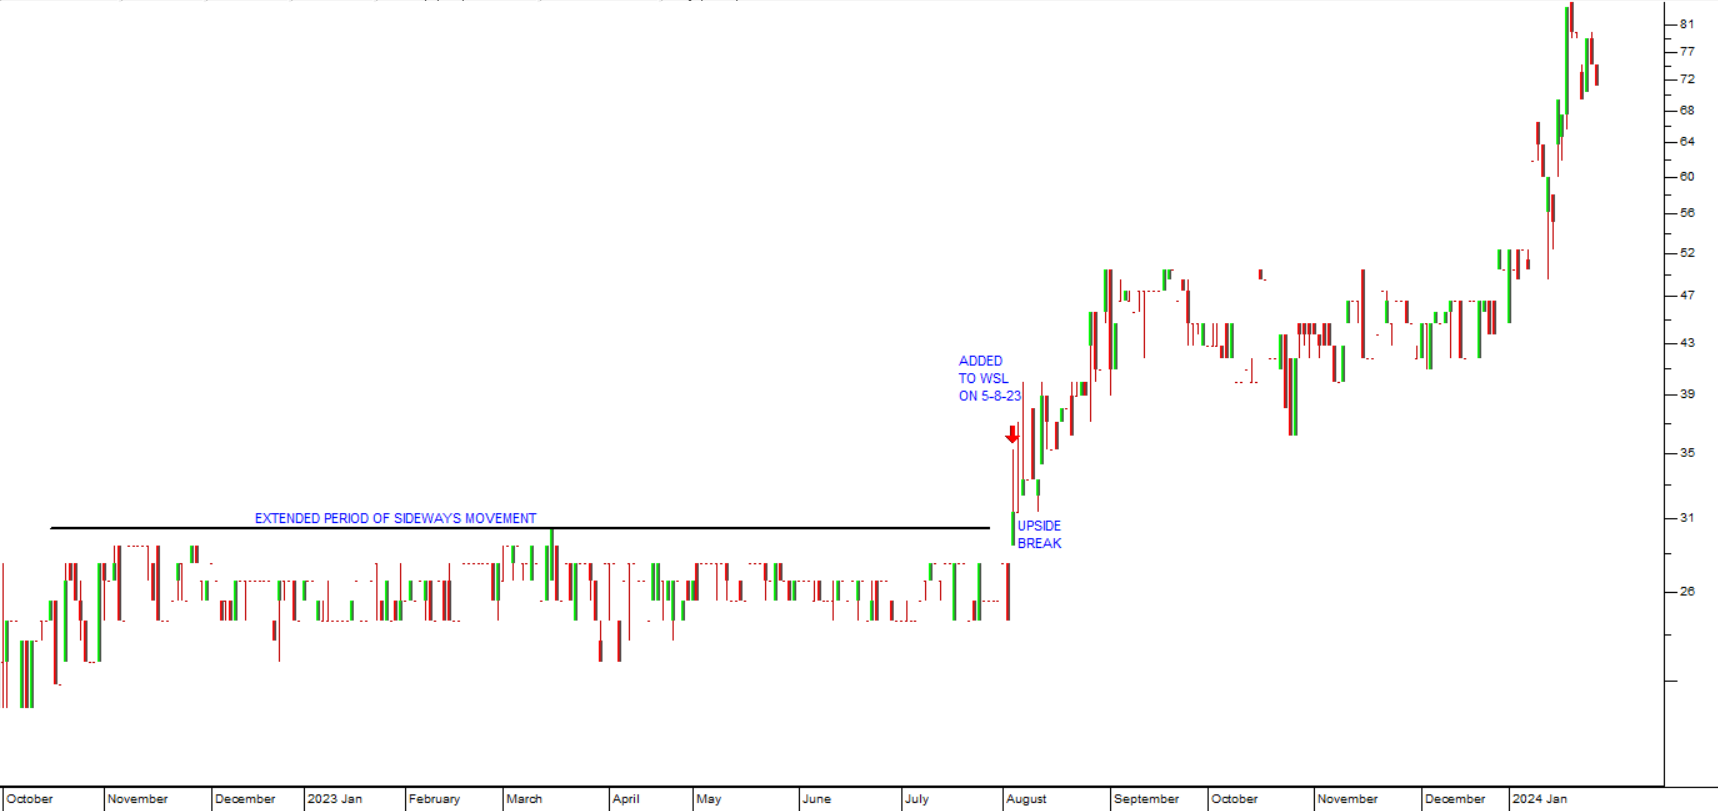
9 October 2019 By PDSNETDuring a strong bull trend 80% of investors are bullish and 20% are bearish – which is why the market rises quickly. The opposite is true of a bear trend. But during both bear and bull trends there is far less uncertainty among investors as to what will happen next. Uncertainty usually expresses itself in sideways markets. During a sideways market (sometimes called a period of “consolidation”) opinion about the future direction of the market is evenly balanced between bulls and bears.
From a technical perspective, the further that a chart departs from its average, the more volatile it becomes and the less certain the future becomes. The most predictable chart is a straight line – the further a chart departs from that, the less predictable it becomes. At the same time, the more volatile a share becomes, the more opportunity there is for capital gain. So, we can reduce this discussion to three words:
Volatility = Unpredictability = Risk
And risk is not necessarily a bad thing because it brings with it the opportunity for profit.
For the private investor it is important to be able to gauge the level of volatility in the market. One of the best ways to do this is by using Bollinger Bands.
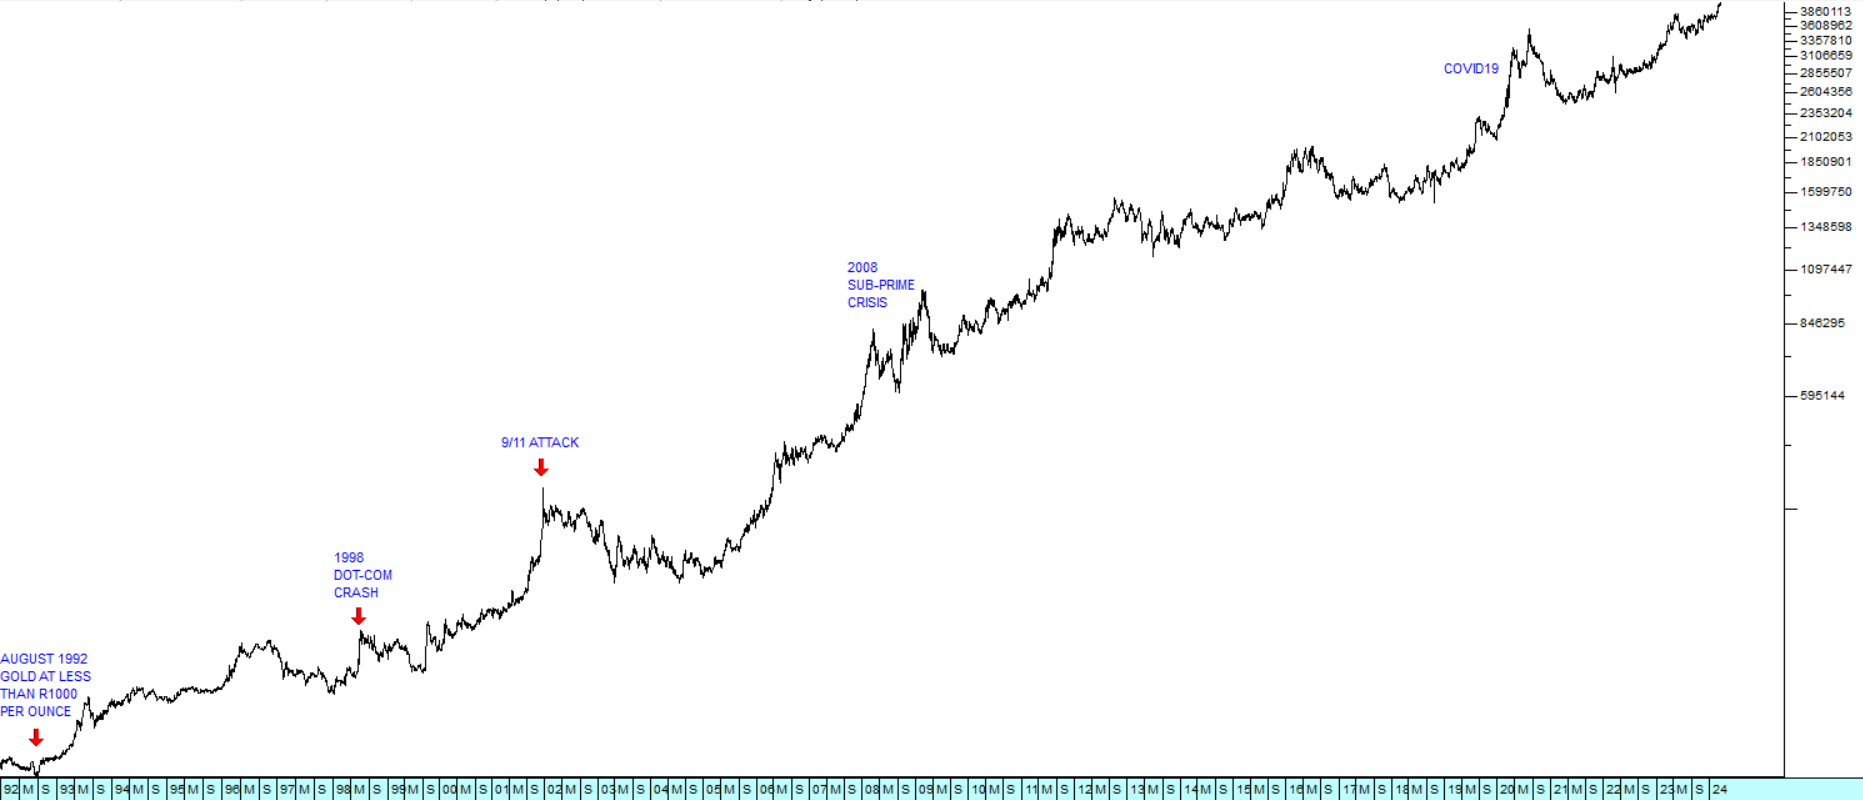
Invented by John Bollinger, Bollinger Bands are drawn 2 standard deviations above and 2 standard deviations below a chosen moving average (If you are uncertain about standard deviation or the construction of Bollinger bands you should re-read module 25). This creates an envelope which contains 95,4% of all the closing prices within the chosen time period. Consider the following semi-log chart:
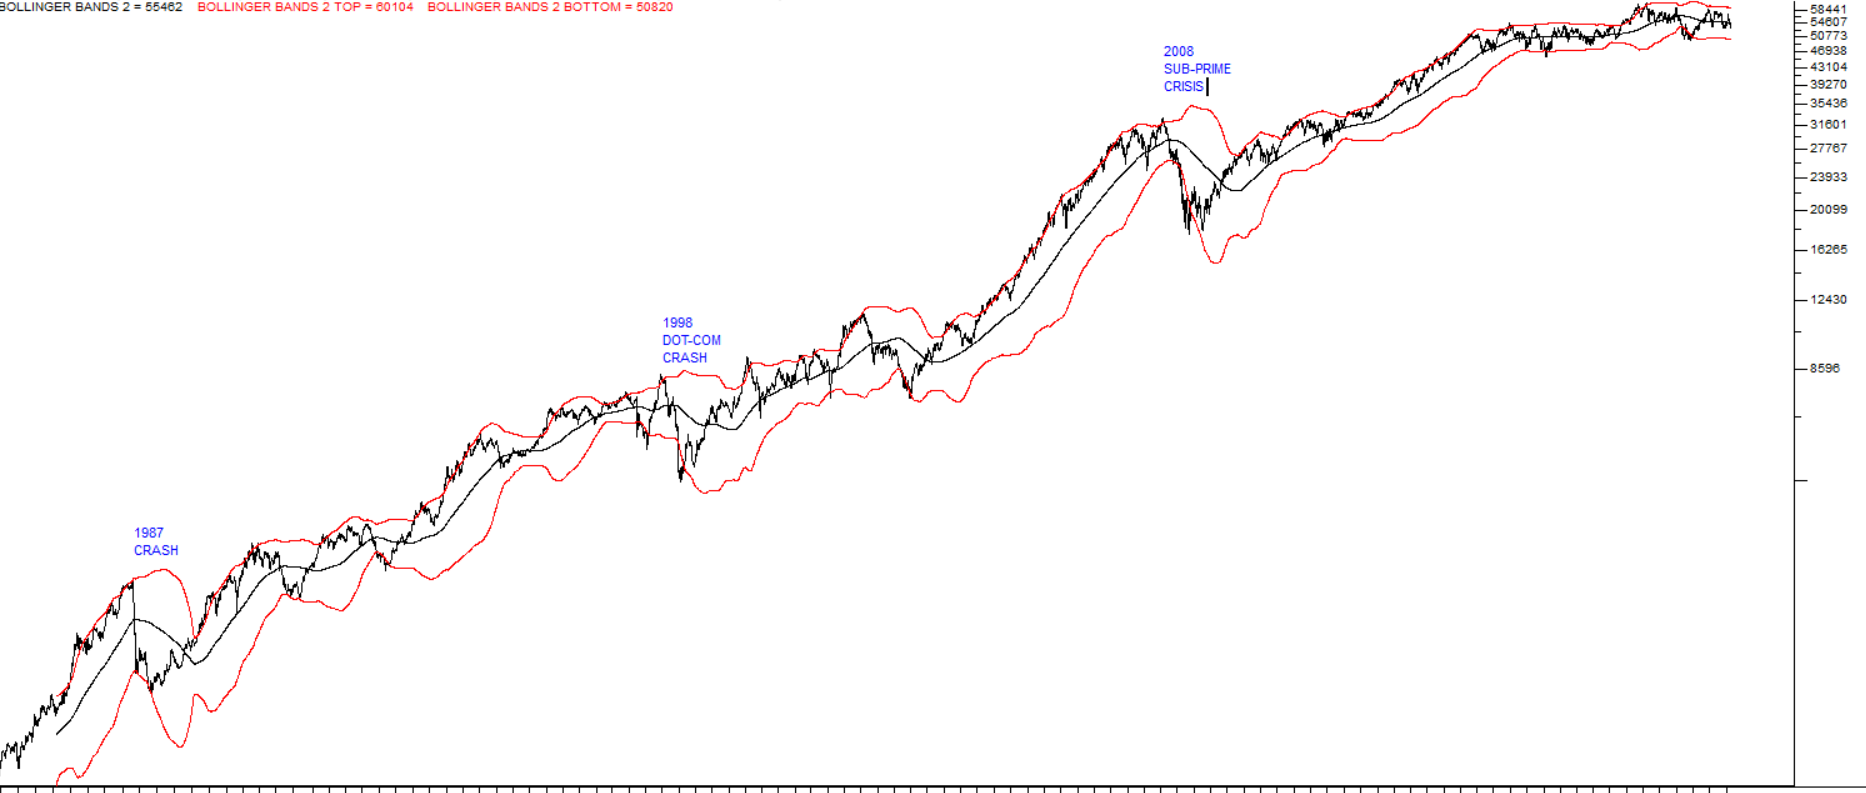
What you see here is the JSE Overall index going back to 1985. The blue line is a 300-day simple moving average and the two red lines represent the upper and lower Bollinger Bands measured from that moving average. The gap between the two Bollinger Bands is a clear indication of volatility. The wider the gap, the more volatile and hence the more unpredictable and risky the market was. You can see that the periods of maximum uncertainty were associated with the 1987 crash, the 1998 dot-com crash and the 2008 sub-prime crisis. You can also see that, once the sub-prime crisis was behind us (from about October 2010), the level of volatility reduced markedly – and since then the market has been noticeably more stable and predictable.
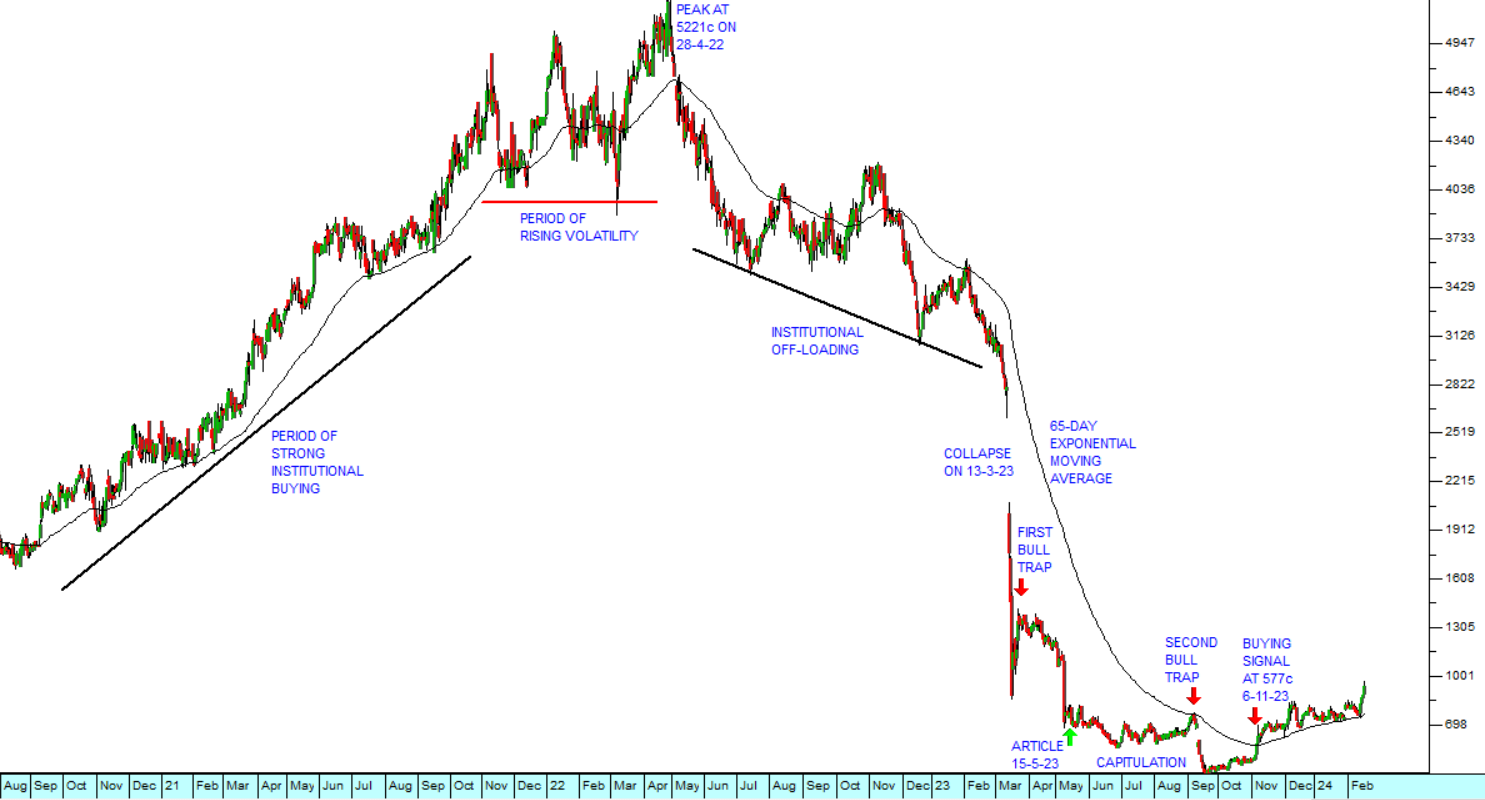
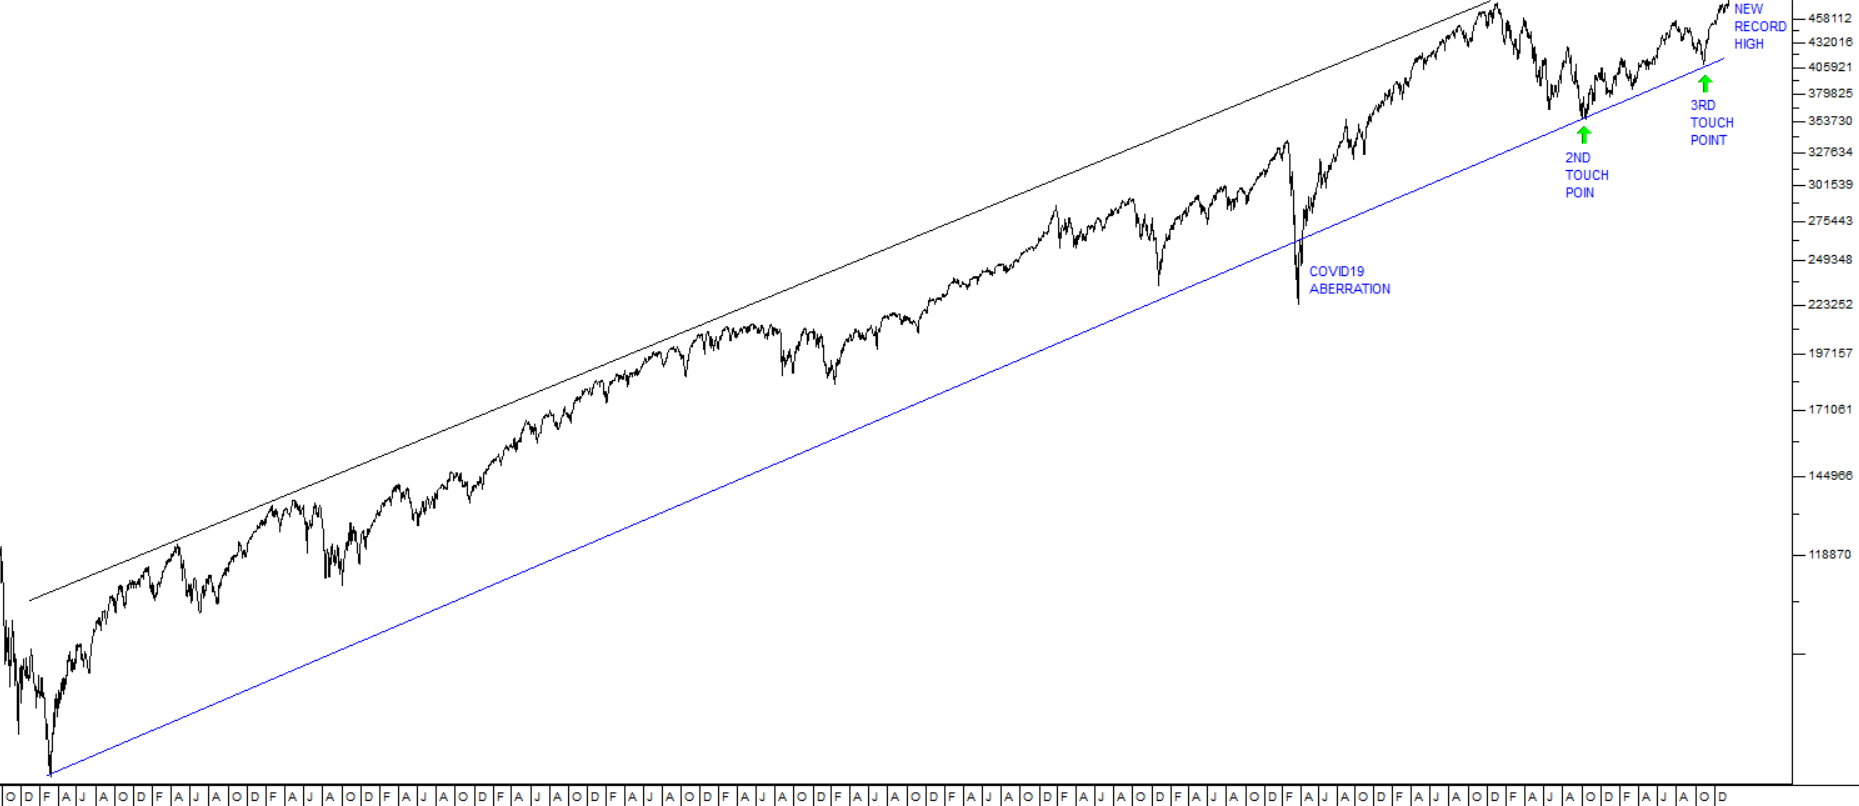
Now consider the S&P500 index over the past two years:
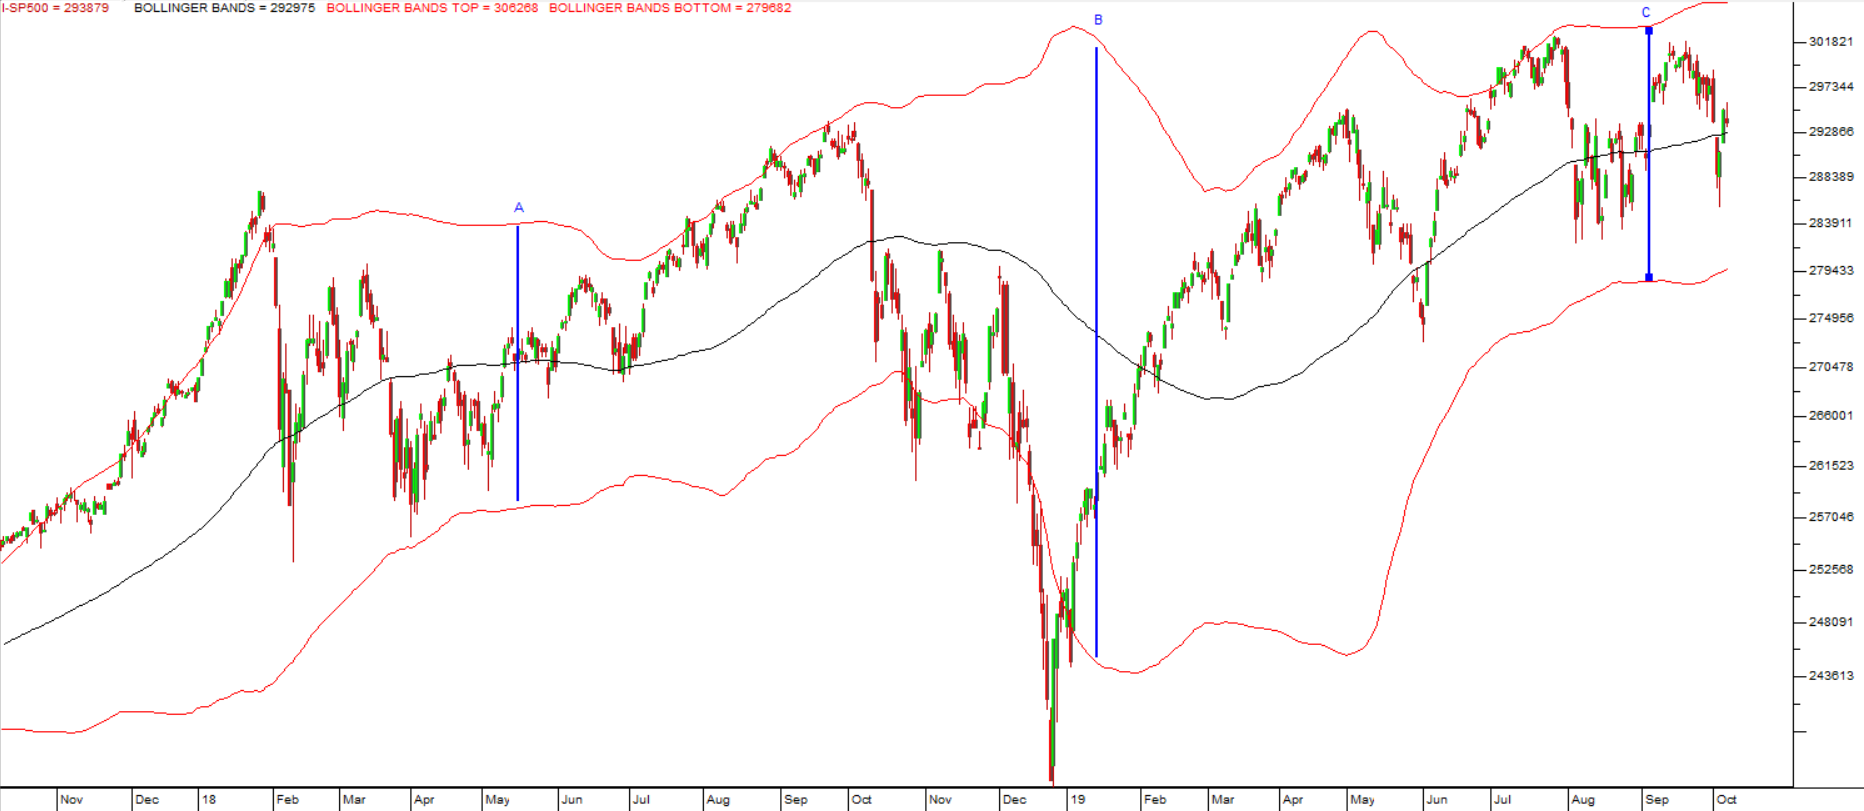
What you can see here is the impact of Trump’s trade war with China which was launched in December 2018. Before that, the gap between the two Bollinger Bands showed relative stability and low volatility (shown in the vertical blue line marked “A”). Following the start of the trade war uncertainty increased and the gap between the Bollinger Bands widened to at least twice what it was before (as shown by the vertical blue line marked “B”). More recently the market has digested and discounted the impact of the trade war and volatility levels have returned to more-or-less what they were before the trade war began.
Of course, the increase in volatility made possible substantial capital gains for the astute investor. As a private investor, volatility often works in your favour. Risk-free investments are also often return-free. So whatever happens in the market you need to view it as a potential opportunity.
DISCLAIMER
All information and data contained within the PDSnet Articles is for informational purposes only. PDSnet makes no representations as to the accuracy, completeness, suitability, or validity, of any information, and shall not be liable for any errors, omissions, or any losses, injuries, or damages arising from its display or use. Information in the PDSnet Articles are based on the author’s opinion and experience and should not be considered professional financial investment advice. The ideas and strategies should never be used without first assessing your own personal and financial situation, or without consulting a financial professional. Thoughts and opinions will also change from time to time as more information is accumulated. PDSnet reserves the right to delete any comment or opinion for any reason.
Share this article: