Vodacom
6 October 2017 By PDSNETVodacom is the largest supplier of cell phone connections in South Africa with 39 million local customers. It also has over 30 million customers outside South Africa. In the June 2017 quarter the company added 2,5 million new customers – 2,3 million of them in South Africa. Vodacom is owned about 65% by Vodaphone.
By anyone’s standards, this company is a blue chip. Most of its income is in the form of annuity income and it has a relatively [glossary_exclude]low[/glossary_exclude] working capital requirement because it is a service company. It does have some exposure to union action, but appears to have that well under control. It is consistently profitable and is benefiting from the explosion of smart phone usage in South Africa.
Vodacom has always been relatively poorly rated compared to other blue chips on the JSE. It consistently trades at a dividend yield of between 4,5% and 5%, probably because its business depends heavily on new technologies and it is well-known that revenues from voice are declining while revenues from data are increasing.
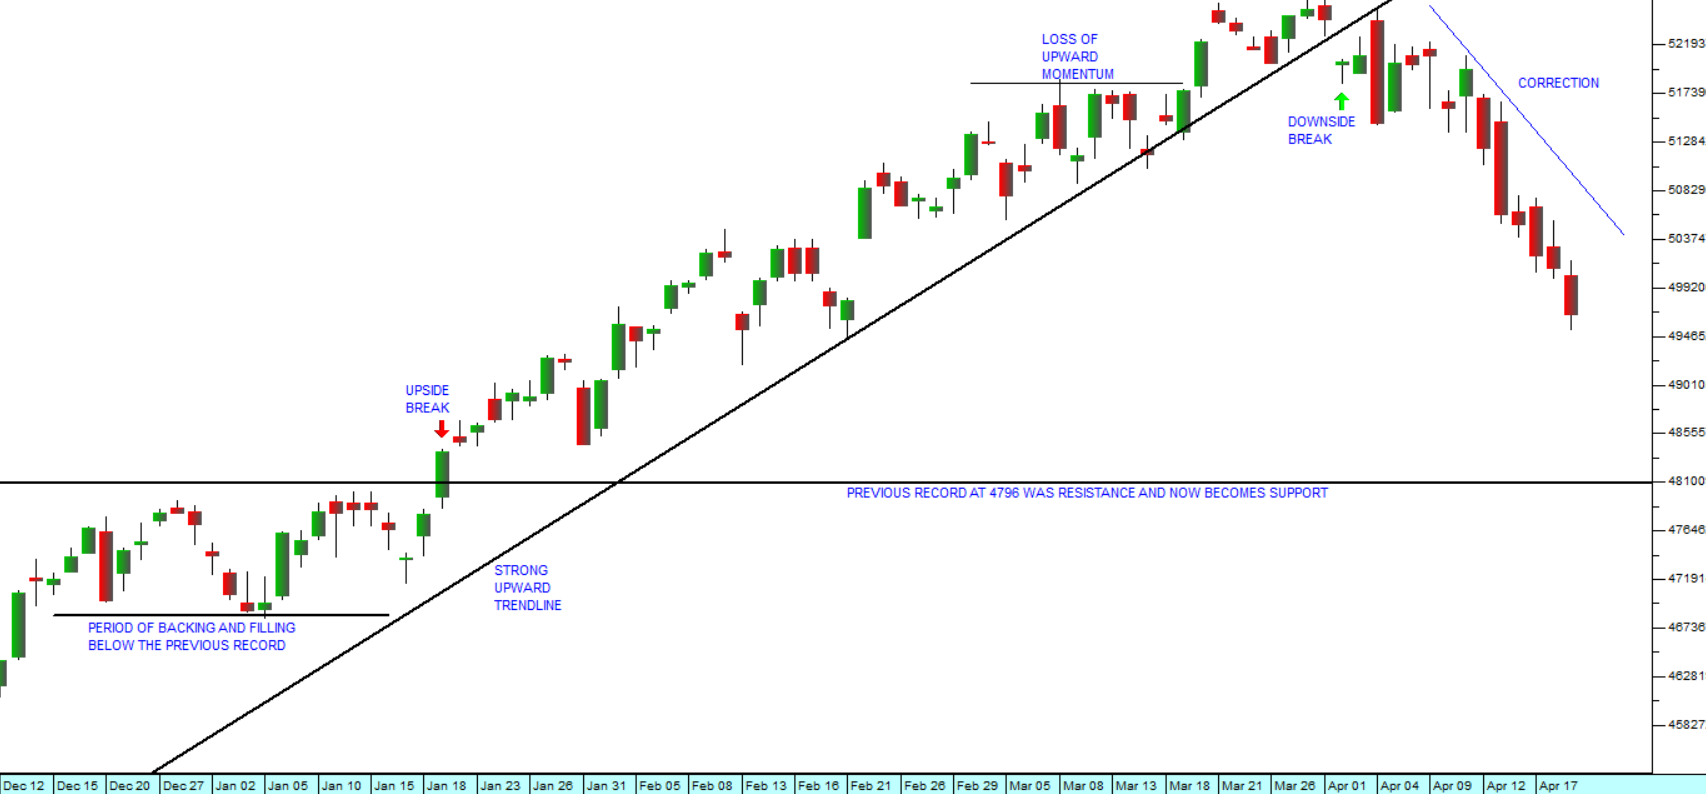
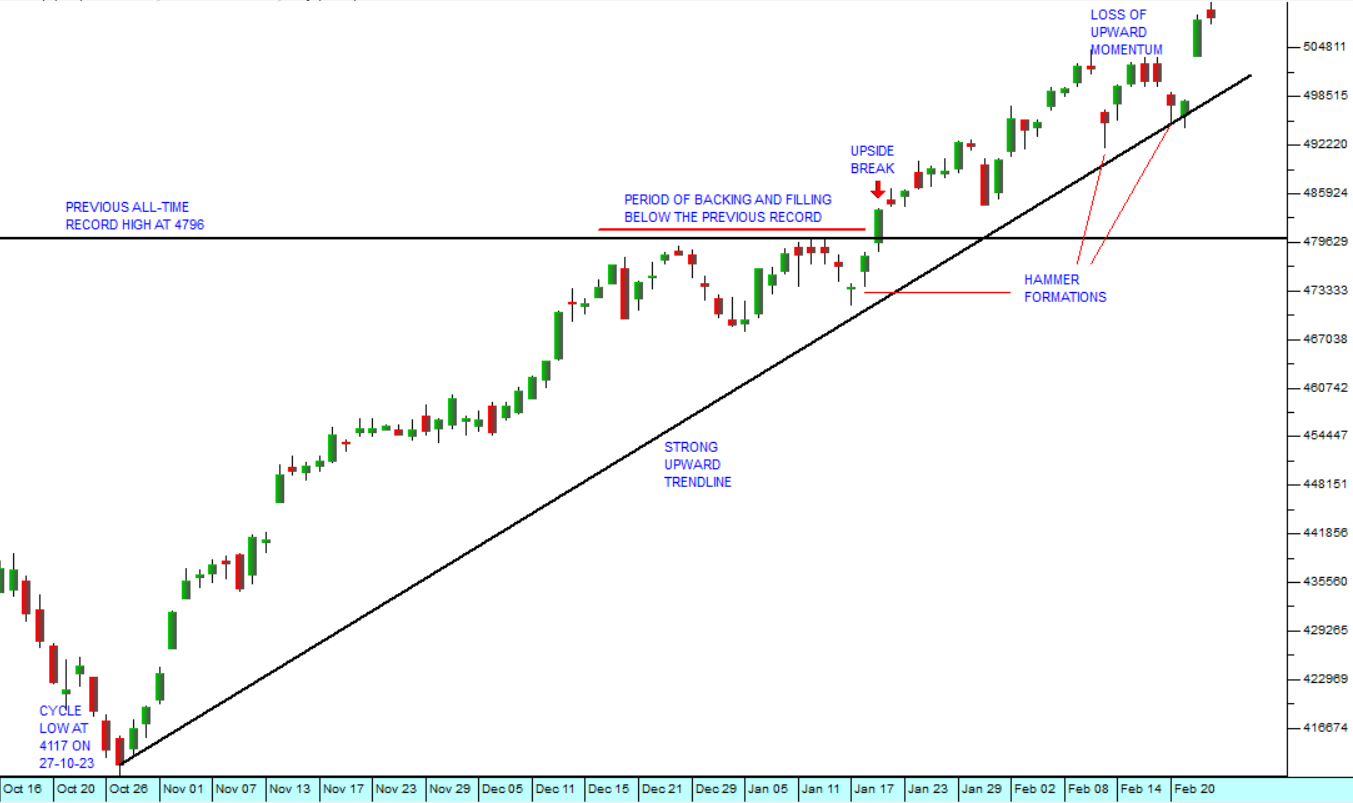
Right now, however, the share is in a very interesting position. It is on its [glossary_exclude]long[/glossary_exclude]-term upward trendline. Consider the chart:
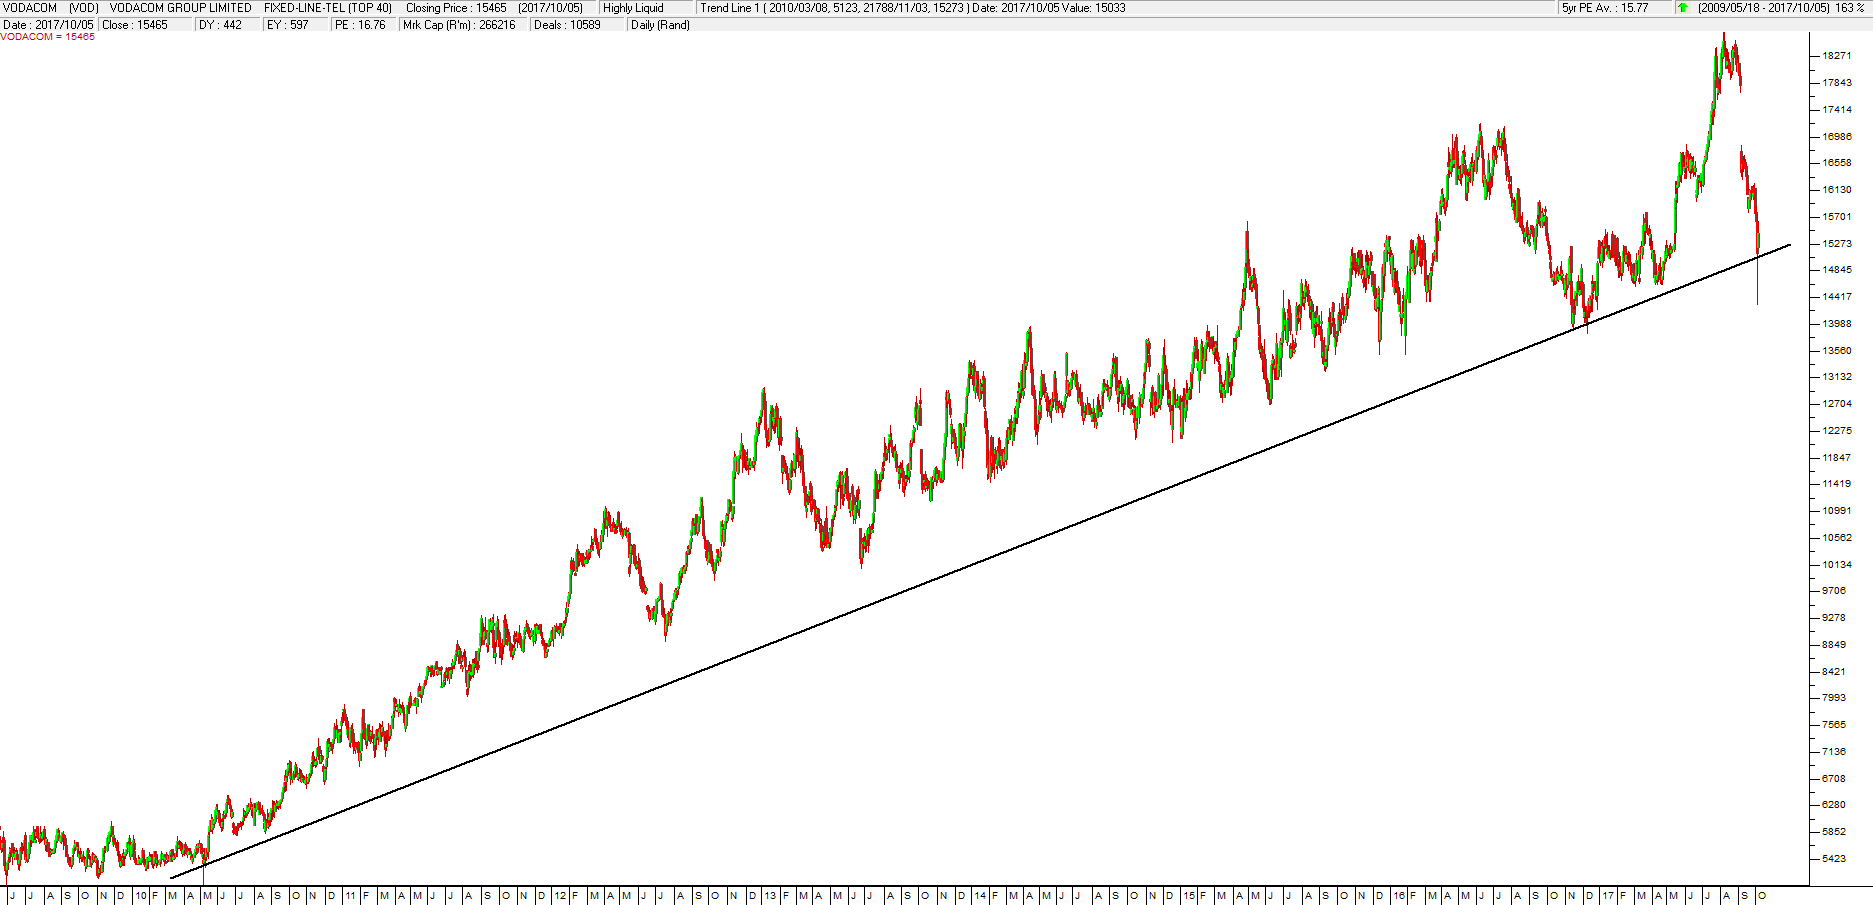
Vodacom Group (VOD) - Chart by ShareFriend Pro
This trendline has three touch points already and the bounce off that line which happened yesterday makes a fourth. The more touch [glossary_exclude]points[/glossary_exclude] that a trendline connects, the more reliable it becomes. More importantly, on 4th October 2017 it produced a classical hammer formation – indicating a cycle low point. The hammer formation in candlestick charting occurs where a candle has a “tail” which is at least twice as [glossary_exclude]long[/glossary_exclude] as the body of the candle. It must also come at the end of a notable downtrend. Hammer formations show that the bears made a very serious attempt to push the share down through key support (the [glossary_exclude]long[/glossary_exclude]-term upward trendline) but failed. A hammer formation requires that the tail is twice as [glossary_exclude]long[/glossary_exclude] as the body of the candle. Consider the chart of the last three months: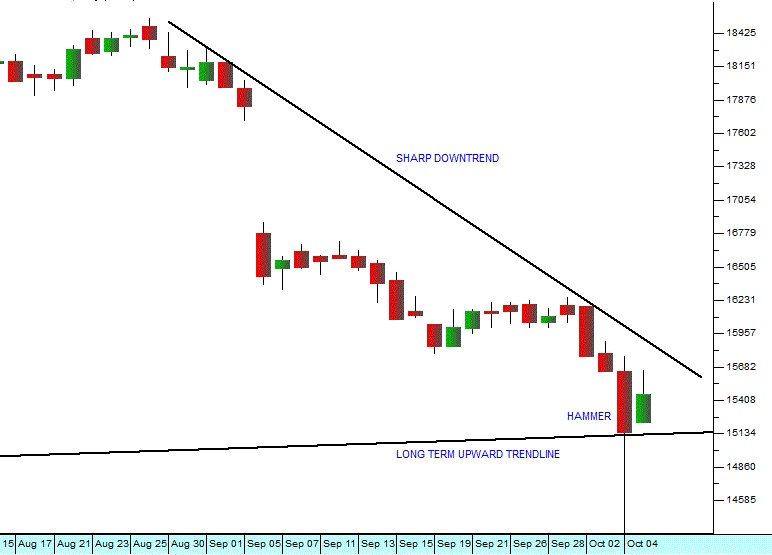
Hammer Formation Vodacom Group - Chart by ShareFriend Pro
Here you can see the hammer formation coming as it does at the end of a short sharp downtrend which took the price back to its [glossary_exclude]long[/glossary_exclude]-term support. In our opinion, this is a [glossary_exclude]high[/glossary_exclude]-quality blue chip share which is now under-valued and which is due for an upward move.DISCLAIMER
All information and data contained within the PDSnet Articles is for informational purposes only. PDSnet makes no representations as to the accuracy, completeness, suitability, or validity, of any information, and shall not be liable for any errors, omissions, or any losses, injuries, or damages arising from its display or use. Information in the PDSnet Articles are based on the author’s opinion and experience and should not be considered professional financial investment advice. The ideas and strategies should never be used without first assessing your own personal and financial situation, or without consulting a financial professional. Thoughts and opinions will also change from time to time as more information is accumulated. PDSnet reserves the right to delete any comment or opinion for any reason.
Share this article: