The PEG Ratio
20 October 2025 By PDSNETSince the government of national unity (GNU) came into power in June 2024, there has been a definite improvement in the South African economy. Perhaps the improvement is not as dramatic as some people were expecting, but the progress cannot be denied.
Possibly the best indicator of that is the 28% rise in the JSE Banking index which, before the GNU had been moving sideways for the previous two years. Banks are generally not very exciting investments. They don’t always make it onto the Winning Shares List (WSL), but they are usually risk-free and they are reliable dividend payers. Right now the average dividend yield on the JSE Banks index is 5.5% - which shows that despite their upward move, banking shares remain relatively cheap.
Perhaps the best way to determine whether a share is cheap is to look at its price:earnings growth (PEG) ratio. The PEG ratio compares the growth in a share’s earnings per share (EPS) with its price:earnings (P:E) ratio. The best way to explain this is with an example.
Standard Bank
Year EPS %
|
2015 |
1487 |
|
|
2016 |
1390 |
-6.52 |
|
2017 |
1638 |
17.84 |
|
2018 |
1723 |
5.19 |
|
2019 |
1594 |
-7.49 |
|
2020 |
777 |
-51.25 |
|
2021 |
1563 |
101.16 |
|
2022 |
2074 |
32.69 |
|
2023 |
2667 |
28.59 |
|
2024 |
2644 |
-0.86 |
|
Average |
13.26 |
|
|
P:E |
8.93 |
|
|
PEG |
0.67 |
Here you can see Standard Banks’s EPS over the past ten years. Thus it produced an EPS of 1487c in 2015 and an EPS of 2644c last year. The PEG takes an average of the percentage growths in the EPS and then divides the current P:E ratio by that – so Standard Bank’s average P:E growth over the 9 years from 2016 to 2024 was 13.26% and if we divide that current P:E ratio of 8.93 by that, we get a PEG of 0.67
Conventional wisdom is that any PEG below 1 represents a share which is under-priced and a PEG above 1 shows that it is over-priced.
Now we can compare this to FirstRand which has the following figures:
FirstRand
Year EPS %
|
2015 |
390 |
|
|
2016 |
402 |
3.08 |
|
2017 |
438 |
8.96 |
|
2018 |
473 |
7.99 |
|
2019 |
539 |
13.95 |
|
2020 |
304 |
-43.60 |
|
2021 |
477 |
56.91 |
|
2022 |
584 |
22.43 |
|
2023 |
648 |
10.96 |
|
2024 |
681 |
5.09 |
|
Average |
9.53 |
|
|
P:E |
10.68 |
|
|
PEG |
1.12 |
So, this shows that FirstRand shares are currently more expensive than Standard Bank, and possibly over-priced. ABSA comes in with a PEG of 0.29 and Nedbank is at 0.26 – showing that they are both very under-priced. Capitec on the other hand has a PEG of 1.41 which means that its ability to grow earnings is now very well established with institutional fund managers and they are prepared to pay a significant premium for its shares.
If you study the EPS of the various banks, you will immediately see that they all took a bit of a hit in 2021 – because of the massive provisions which they all made that year for bad debts due to COVID-19. Over the succeeding years, those provisions were unwound. However, if we say that 2021 was an aberration and we calculate the PEG just for the years 2022 to 2024 then the results are:
| Company | PEG | Dividend Yield (DY) |
| Standard Bank | 0.44 | 5.02 |
| FirstRand | 0.83 | 4.66 |
| Nedbank | 0.38 | 7.38 |
| ABSA | 0.97 | 6.51 |
| Capitec | 0.81 | 1.43 |
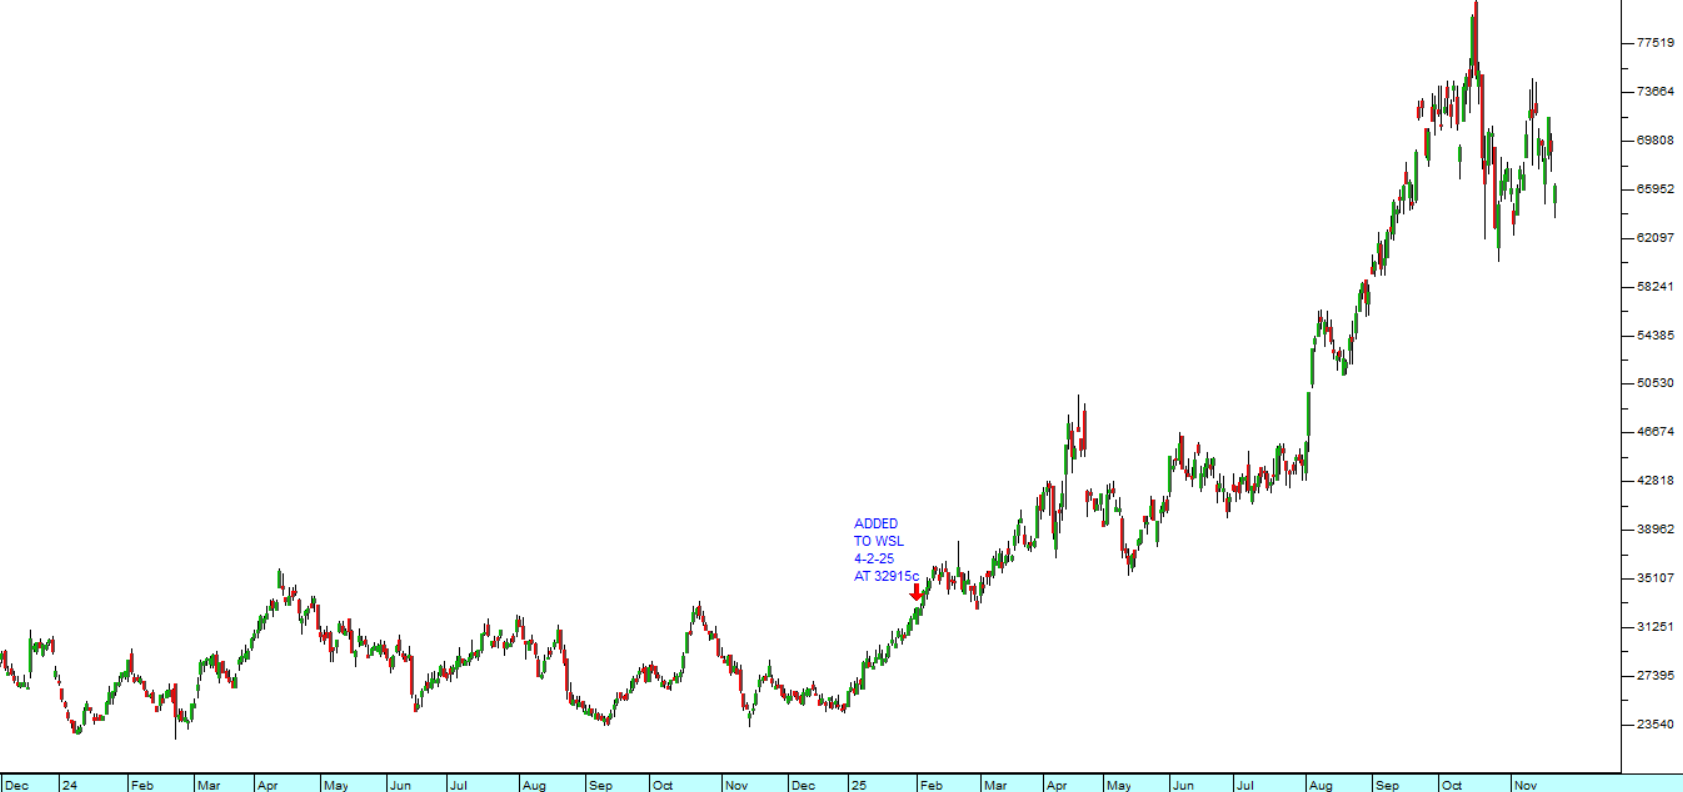
This shows that the most fully valued bank is in fact ABSA while Capitec and FirstRand still look reasonable. Over the past three years Nedbank offers the best PEG value at 0.38, closely followed by Standard Bank at 0.44. Nedbank is now at a dividend yield (DY) of 7.38% which is a very solid return for a large banking share and if you want to buy Capitec you must accept a DY of just 1.43%. But, Capitec has shown its ability to continuously generate above-average returns in this highly competitive industry. We added Capitec to the WSL on 4th November 2023 and it has more than doubled since then. Nedbank has still not made it onto the WSL.
The PEG ratio is a very useful tool for establishing whether a share is over- or under-priced and you can use it for any blue-chip or secondary share that produces regular profits.
DISCLAIMER
All information and data contained within the PDSnet Articles is for informational purposes only. PDSnet makes no representations as to the accuracy, completeness, suitability, or validity, of any information, and shall not be liable for any errors, omissions, or any losses, injuries, or damages arising from its display or use. Information in the PDSnet Articles are based on the author’s opinion and experience and should not be considered professional financial investment advice. The ideas and strategies should never be used without first assessing your own personal and financial situation, or without consulting a financial professional. Thoughts and opinions will also change from time to time as more information is accumulated. PDSnet reserves the right to delete any comment or opinion for any reason.
Share this article: