The JSE is best
23 January 2023 By PDSNETPDSnet has what is arguably one of the longest consistent databases of JSE share prices in South Africa. Indeed, there have been times over the decades when the JSE itself has asked us for a copy of our data to replace lost records. This database enables us to go back in history to get some perspective on exactly how good the JSE has been over the long term as an investment.
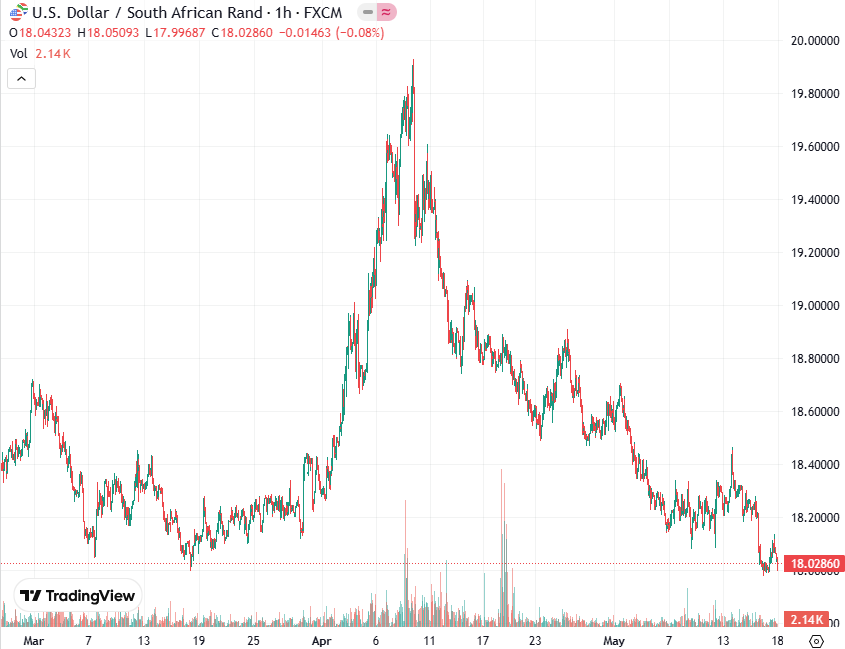
Last week, on Wednesday 18th January 2023, the JSE Overall index reached an all-time high of 79865. This is despite all the problems both inside South Africa and outside. This record high must be compared with 28th February 1985 when the index closed at 939 and, hard as it is to believe now, the rand was then hovering at around R2 to the US dollar. Last week, on Friday the 20th January 2023, the rand was trading at R17.14 to the US dollar. It has recently been as high as R18.41, on 24th October 2022.
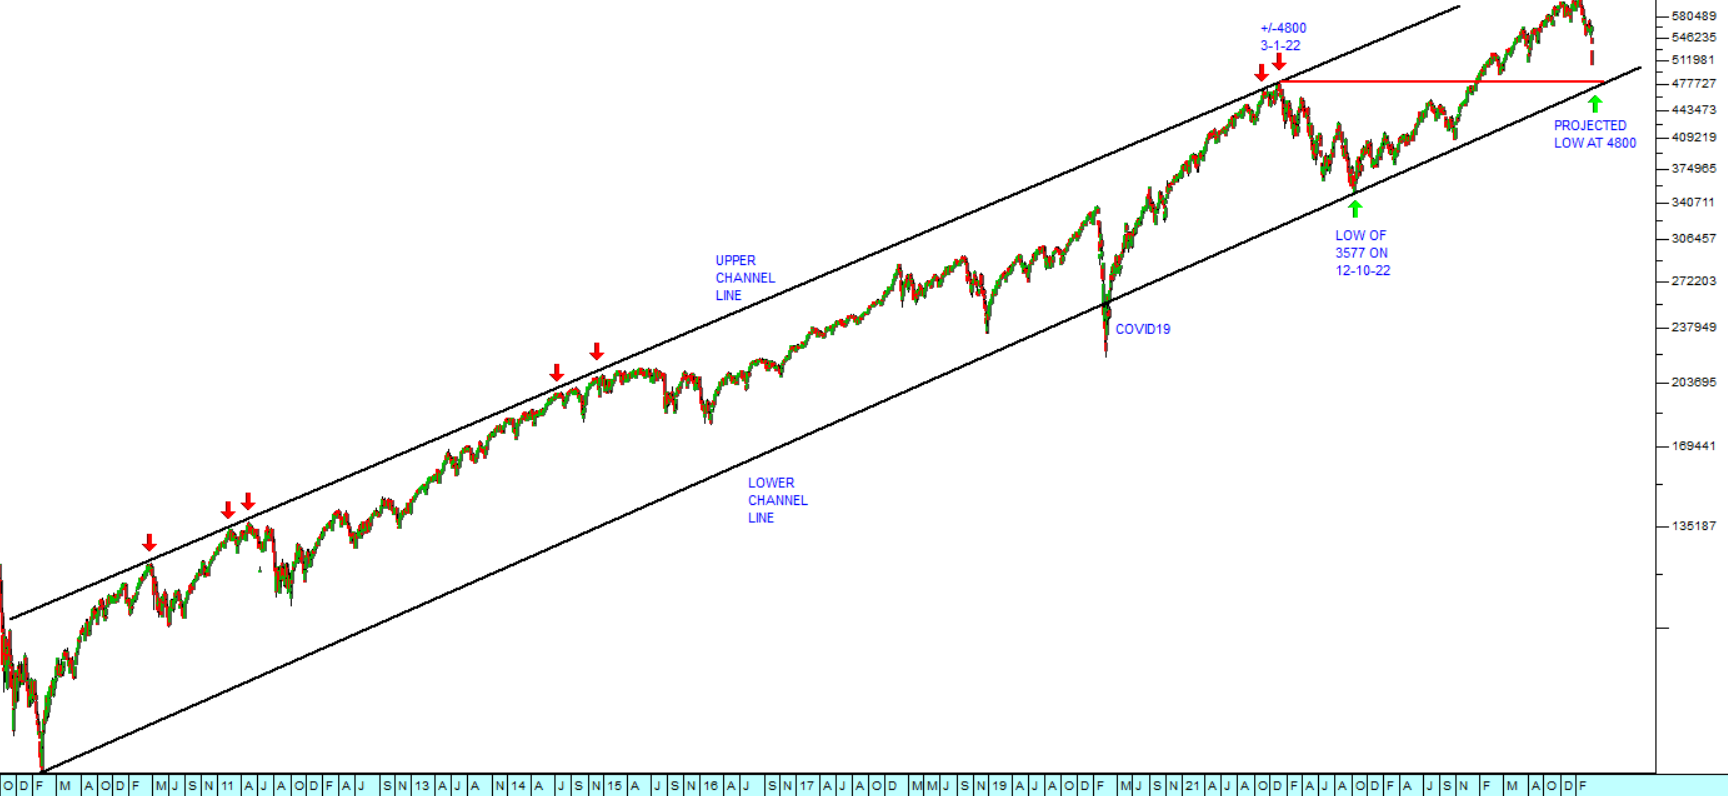
This means that over that period of almost 38 years, the JSE has gone up on average by roughly 85-fold while the rand has lost close to 90% of its value. This analysis shows that, despite the massive fall in the purchasing power of the rand and its value against first world currencies, an investment in the JSE over that time would have handsomely compensated the investor. Consider the chart:
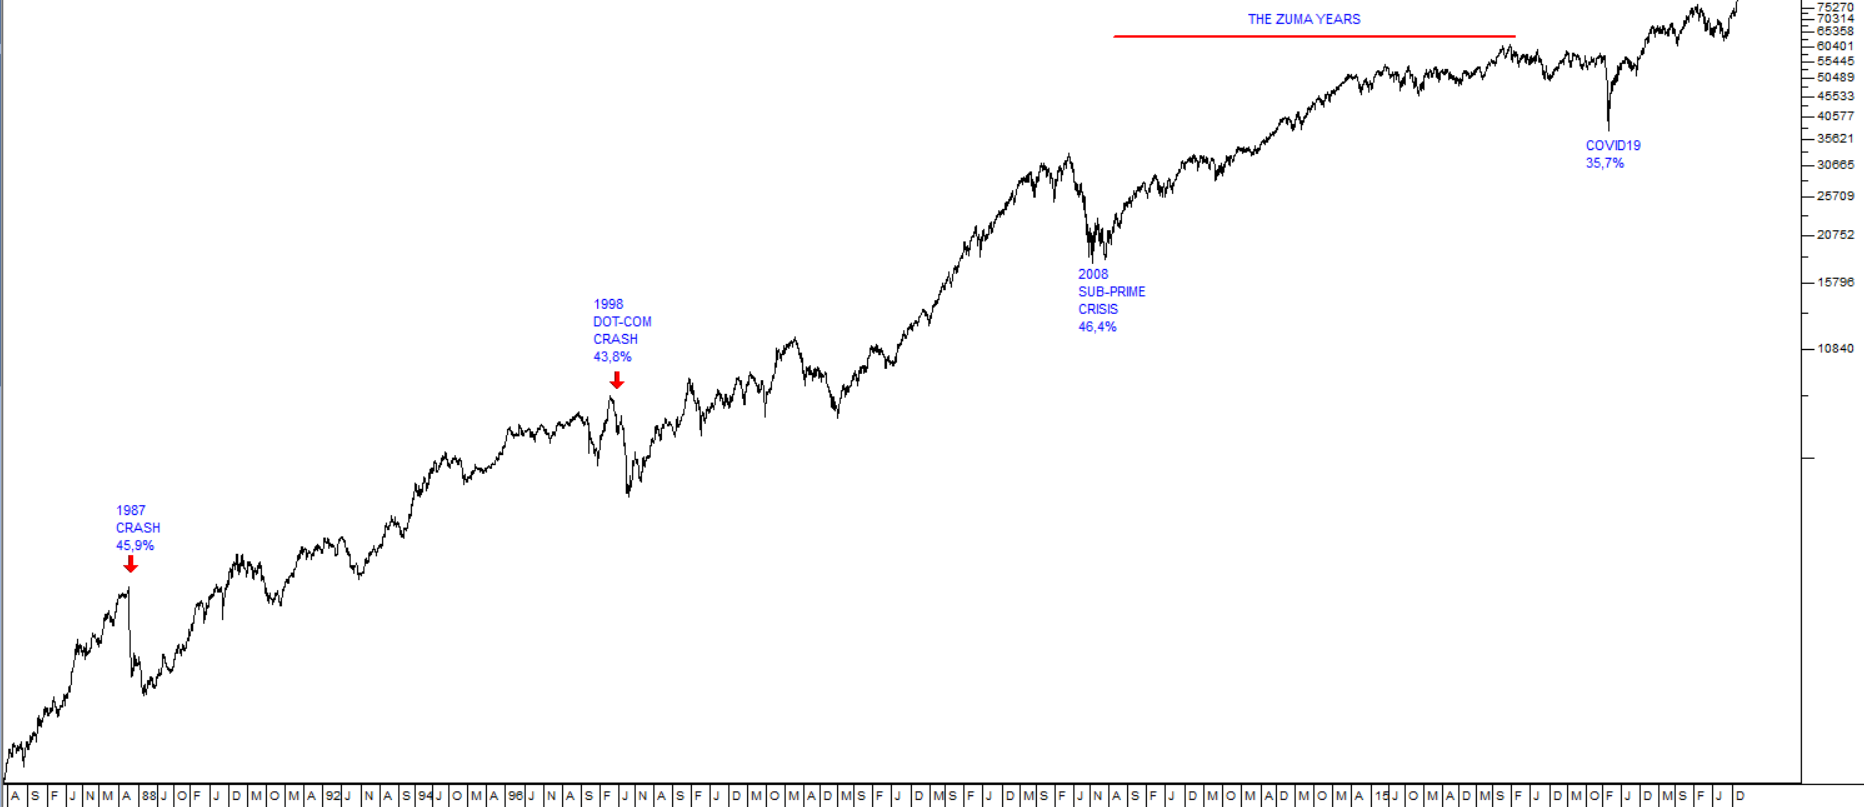
This is a semi-logarithmic chart of the JSE Overall index from 28th February 1985 to 20th January 2023. It shows the effect of the 1987 crash, the 1998 dot-com crash, the 2008 sub-prime crisis, the years when Zuma was president and, finally, the effect of COVID-19.
Throughout all these calamities, high-quality shares on the JSE have continued to grow steadily, more than compensating for the fall in the rand’s value against the major hard currencies of the first world.
So, does this mean that you can take a “buy-and-hold” approach to the JSE? Just find some quality blue-chip shares and hold them for the long term? The answer is “no.” Because the components of the JSE Overall index have changed significantly over the 38 years, as shown in the chart above.
Some of the shares (like most of the major construction companies) have disappeared completely while new shares (like Naspers) are now included. To be successful in the long term, you cannot just buy a bunch of blue-chip shares and put them in your bottom drawer. You have to stay alert to what is going on in the market and make occasional strategic changes.
This does not imply that you will be jumping in and out all the time – just that you will periodically (like once every few years) recognize that the environment has shifted and that which was a good investment ten or twenty years ago has passed its best.
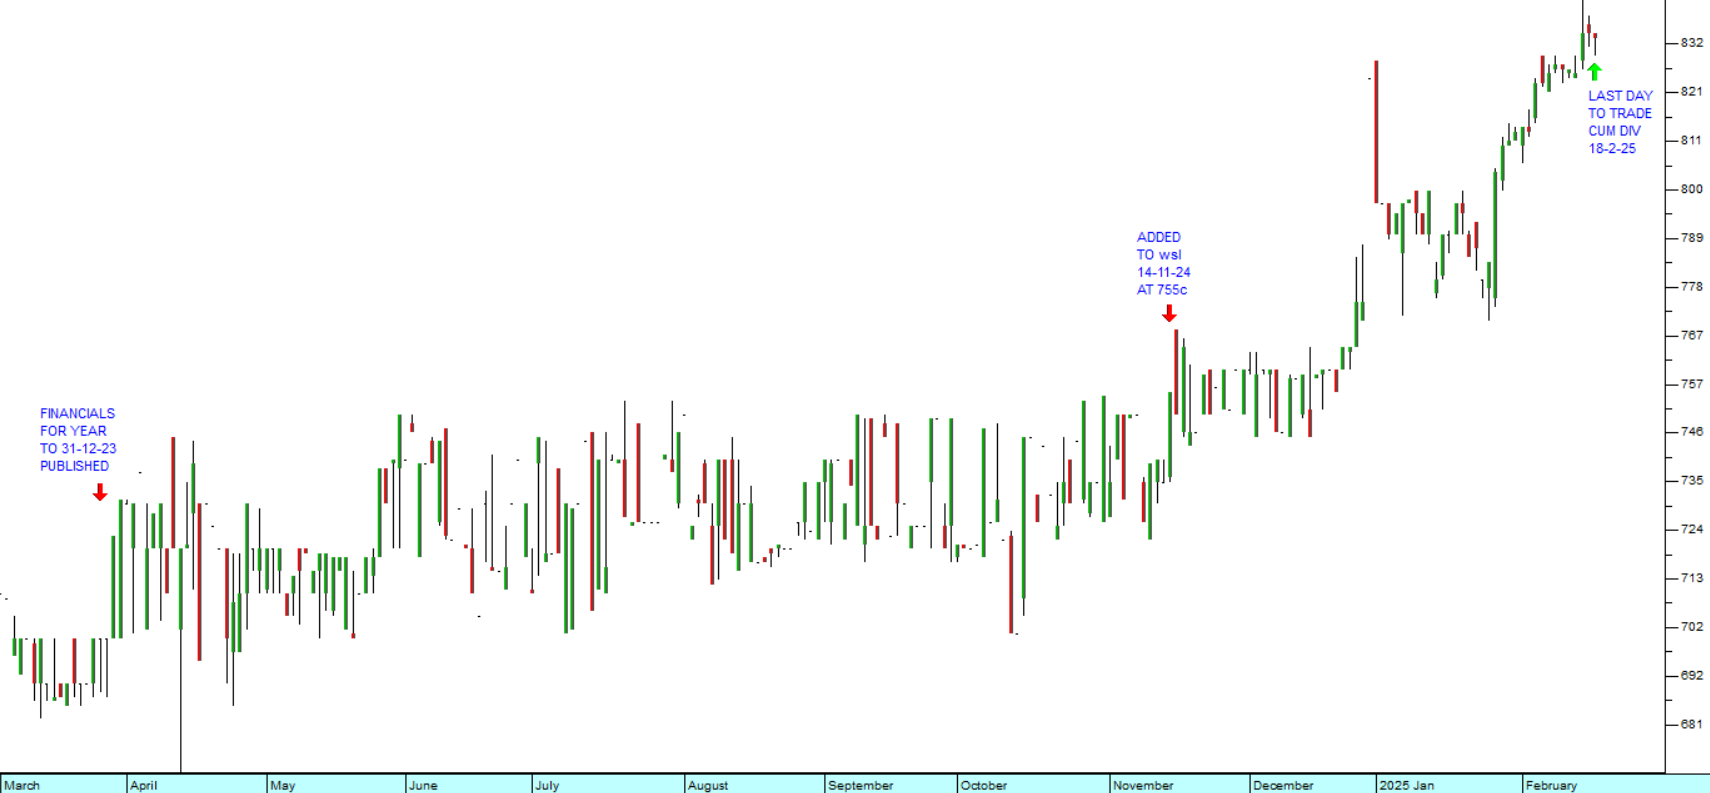
With that in mind, some shares remain evergreen. For example, the earliest price we have in our database for Santam is on 28th February 1985 when it closed at 90c. Today that share is 26052c and it has been as high as 30038c as recently as 4th May 2022. It is what we describe as a “diagonal” share because its chart goes from the bottom left-hand corner of your screen to the top right-hand corner.
DISCLAIMER
All information and data contained within the PDSnet Articles is for informational purposes only. PDSnet makes no representations as to the accuracy, completeness, suitability, or validity, of any information, and shall not be liable for any errors, omissions, or any losses, injuries, or damages arising from its display or use. Information in the PDSnet Articles are based on the author’s opinion and experience and should not be considered professional financial investment advice. The ideas and strategies should never be used without first assessing your own personal and financial situation, or without consulting a financial professional. Thoughts and opinions will also change from time to time as more information is accumulated. PDSnet reserves the right to delete any comment or opinion for any reason.
Share this article: