Tech Drives the S&P
4 September 2017 By PDSNETThe correction on the S&P500 index which we spoke of in previous articles is, thus far, proving to be shorter and shallower than we thought - hardly even really a buying opportunity – yet. The nuclear test on Sunday by North Korea will probably unnerve markets when they [glossary_exclude]open[/glossary_exclude] on Tuesday after the labour-day holiday today, but the holiday will have given time for markets to absorb the impact and adjust. The S&P500 has fallen by just less than 3% so far over 9 trading days from its all-time intra-day high of 2490.87 made on Tuesday 8th August. In our view, it seems unlikely that the correction will resume and we are anticipating a new all-time record high on the S&P in the next couple of weeks. The key factor sustaining this great bull market and driving it higher is the perception of rising profitability among high-tech shares with Apple leading the way. Riding on the back of the 237 000 new jobs created in July month, it seems that various technologies are and will be coming together to produce higher-than-expected profits over the next year and beyond. Consider the following forecasts for profit growth in the technology sector:
Q2 2018: +11.5%
Q1 2018: +12.3%
Q4 2017: +11.3%
Q3 2017: + 9.7%
Q2 2017: +16.7% (actual)
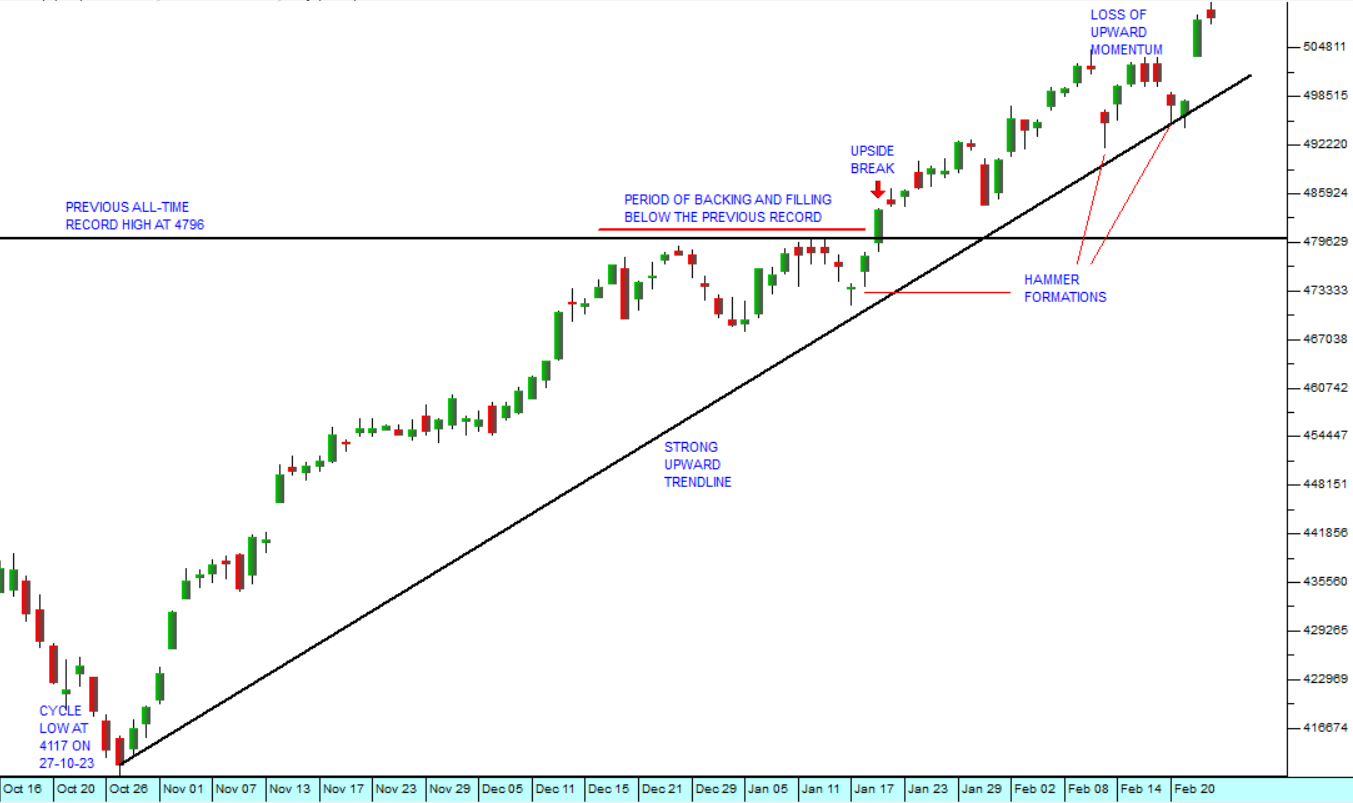
Clearly, there are much-improved business efficiencies flowing from various technologies which are being stimulated by the continuing Federal Reserve Bank policy of easy money in America. And these efficiencies, which are expected to impact on tech company profits, will also, inevitably, flow through to the entire business world over time. On [glossary_exclude]top[/glossary_exclude] of this, the oil price remains at less than half the level it was in the middle of 2014. The ISM manufacturing index in America has reached its highest level since 2010 (58,8) indicating that the US economy is growing strongly. The ISM is derived from a survey of 300 purchasing managers in the US. It is one of the earliest indications of what is happening in the economy each month and a very good predicter of stock market trends. Leading analysts are now talking about an upside target of 2700 for the S&P – which is still well below the 3027 level that we suggested in December last year based on a point & figure horizontal count (click here to view this article). Consider the chart: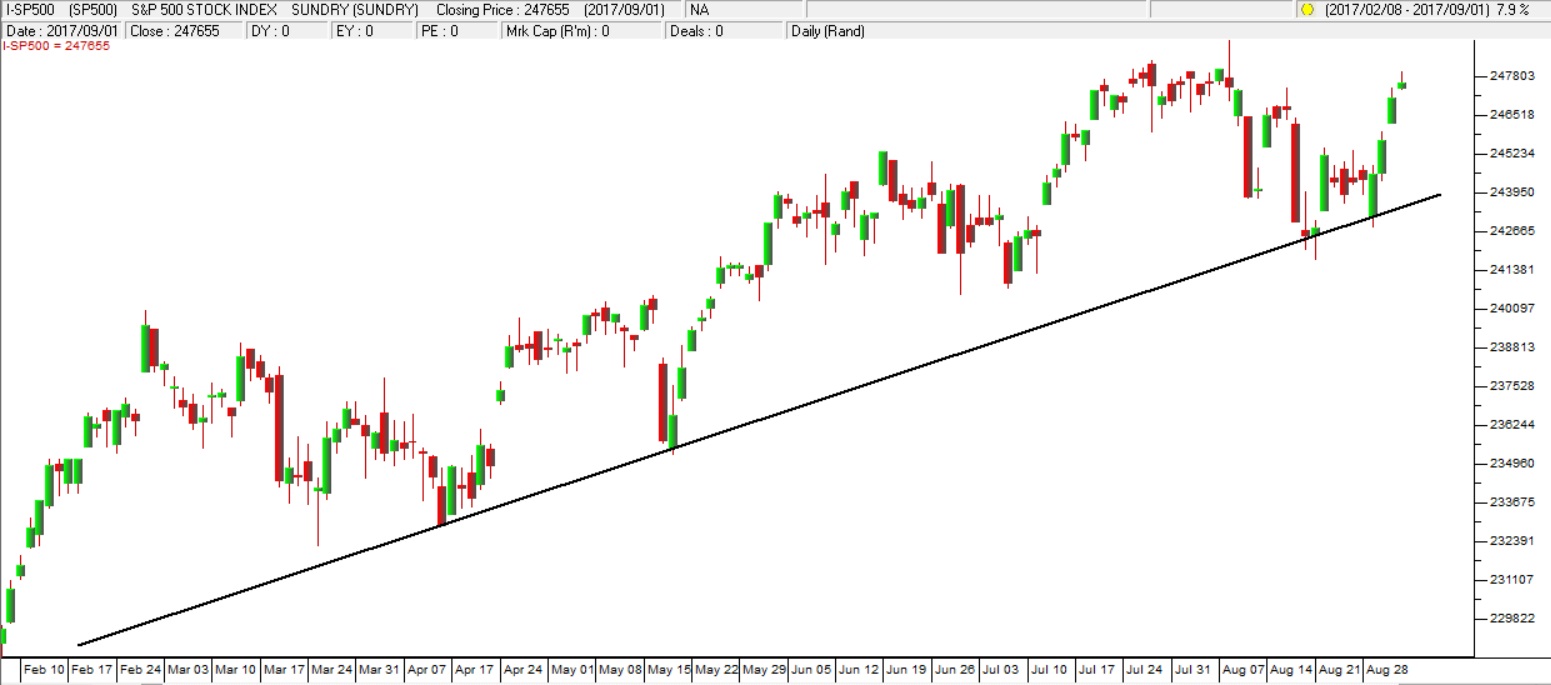
S&P500 Index - Chart by ShareFriend Pro
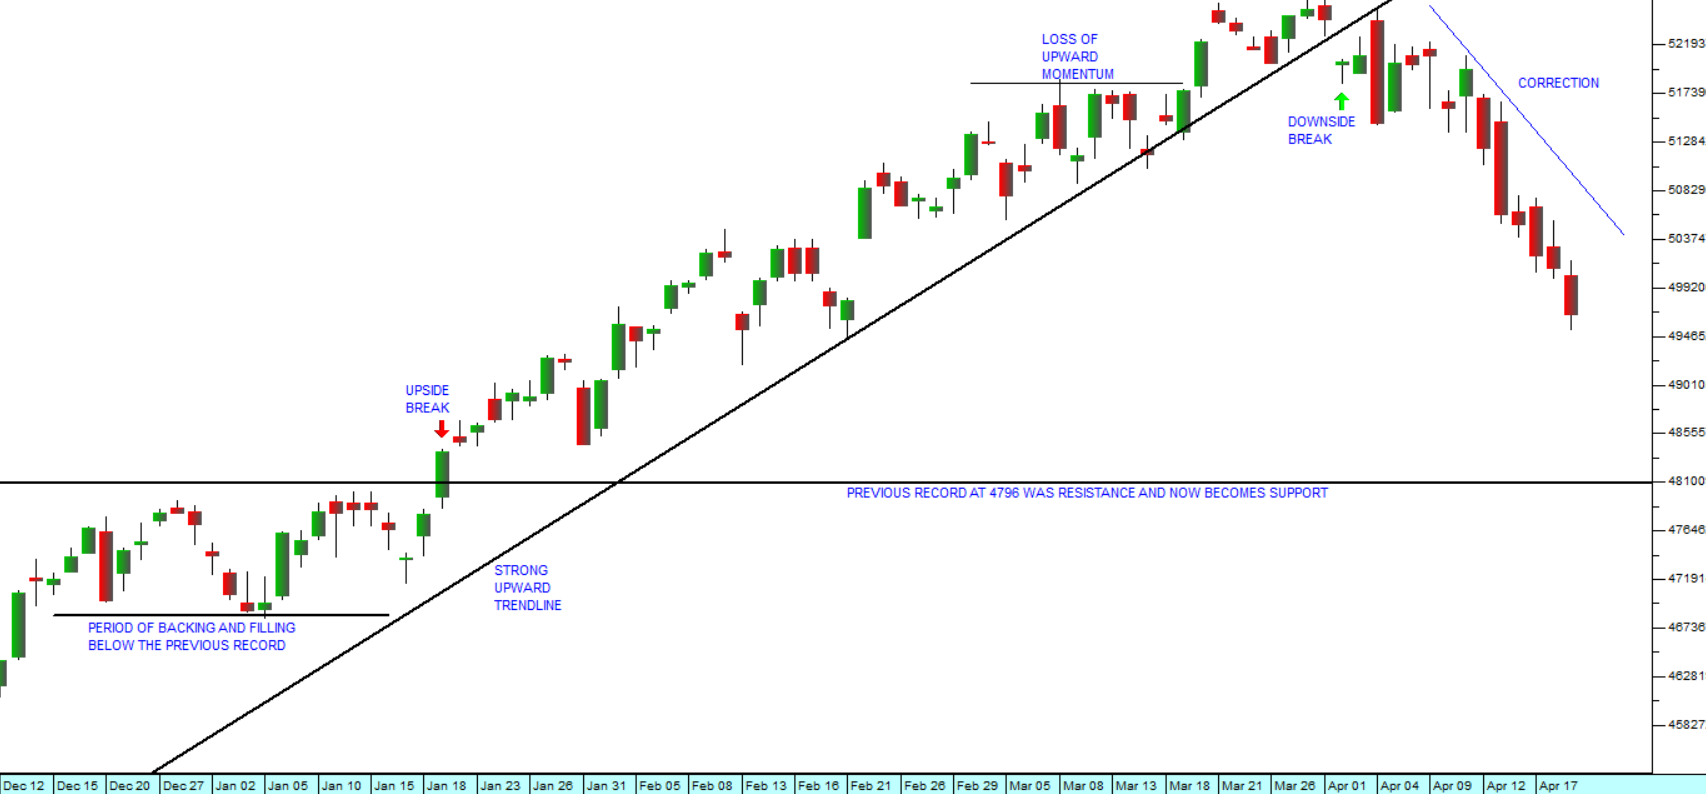
The mood on Wall Street is strongly bullish. In a market like this, negative factors (like the North Korean nuclear test on Sunday) tend to be minimised and short-lived, while positive factors are emphasised and prolonged. Every slight fall on the S&P is being seen as a buying opportunity. This is the nature of a great [glossary_exclude]bull[/glossary_exclude] market. And our market, having been trapped in a sideways pattern for three years, continues with its upside breakout.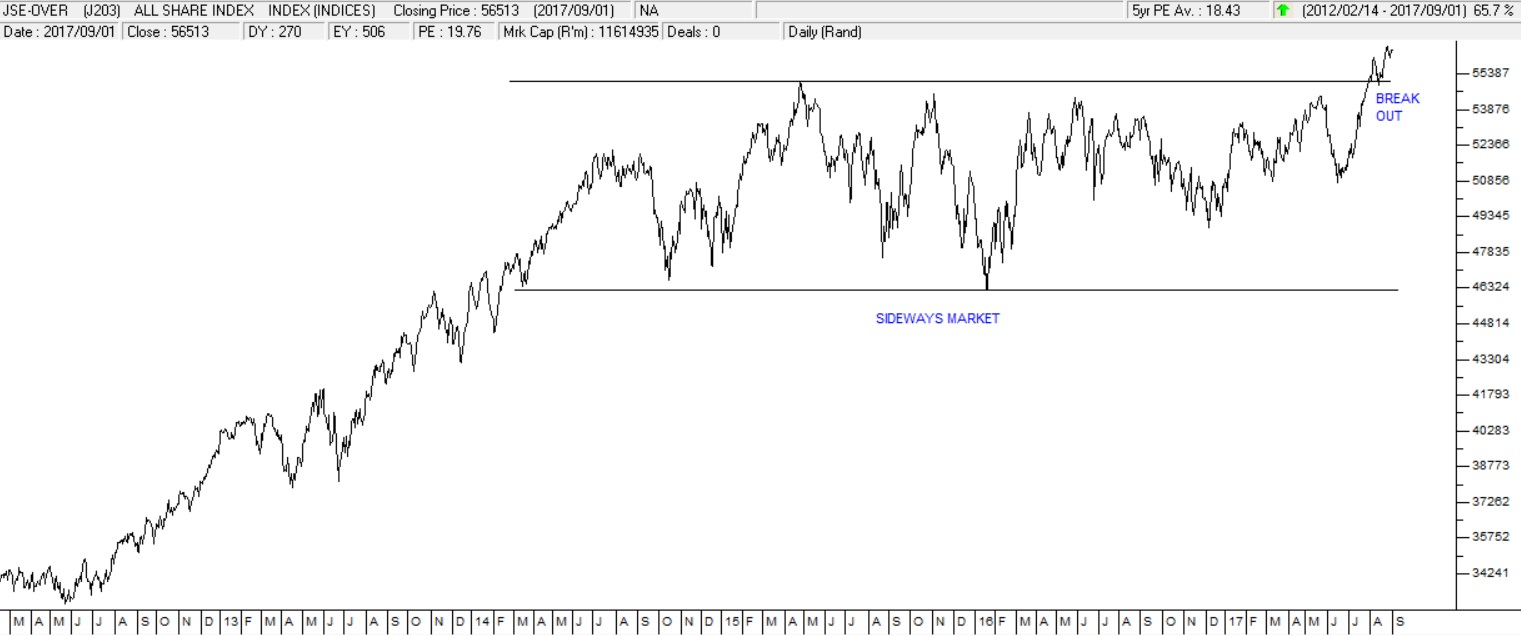
JSE Overall Index - Chart by ShareFriend Pro
DISCLAIMER
All information and data contained within the PDSnet Articles is for informational purposes only. PDSnet makes no representations as to the accuracy, completeness, suitability, or validity, of any information, and shall not be liable for any errors, omissions, or any losses, injuries, or damages arising from its display or use. Information in the PDSnet Articles are based on the author’s opinion and experience and should not be considered professional financial investment advice. The ideas and strategies should never be used without first assessing your own personal and financial situation, or without consulting a financial professional. Thoughts and opinions will also change from time to time as more information is accumulated. PDSnet reserves the right to delete any comment or opinion for any reason.
Share this article:
_art4mAy24.png)