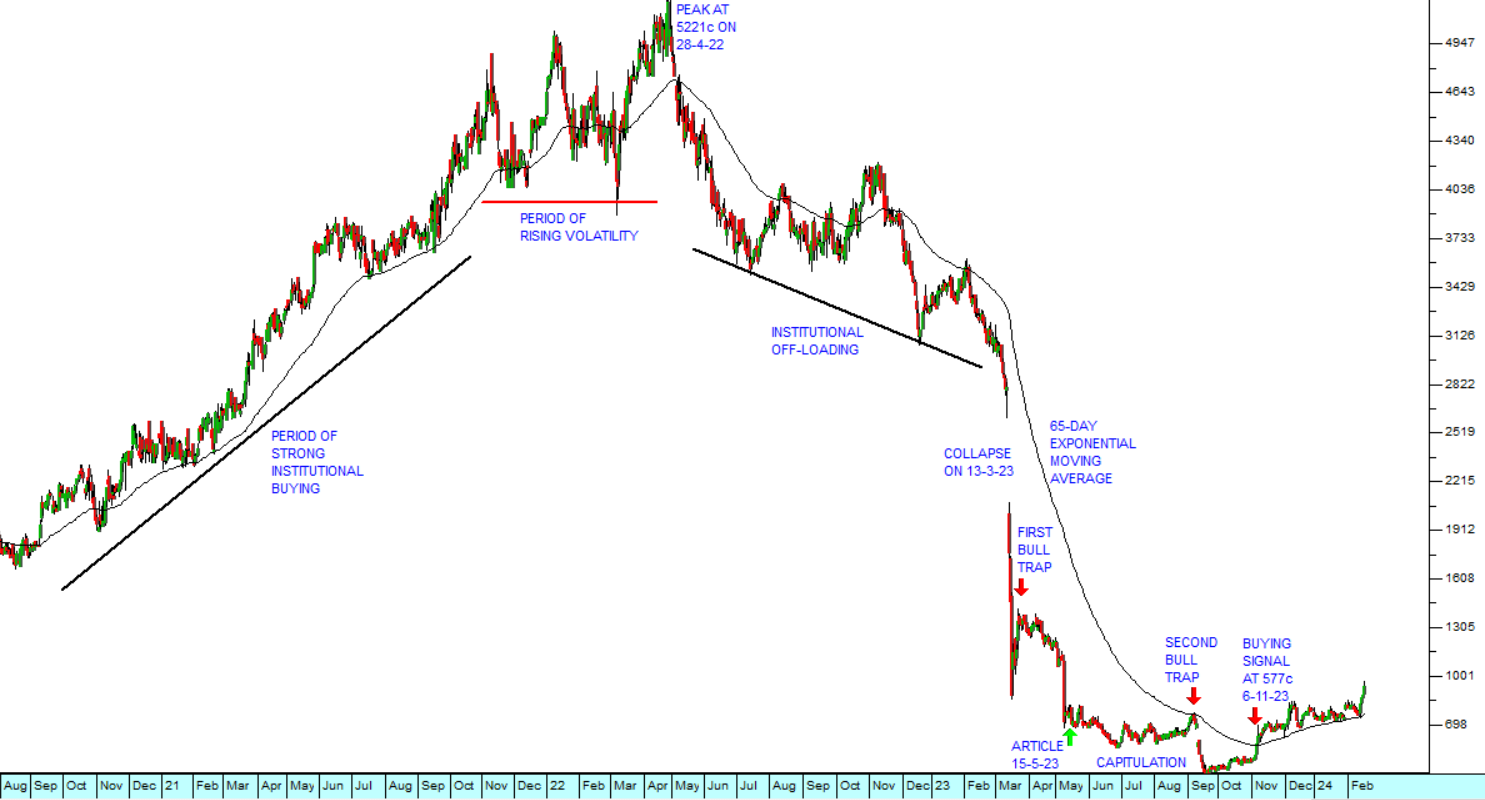
Steinhoff Breaks Up At Last
13 July 2018 By PDSNETWhen a blue chip, institutional share like Steinhoff falls heavily, there are always private investors looking to buy it at its much reduced price hoping to make a quick profit. But there is great danger in taking a position too early.
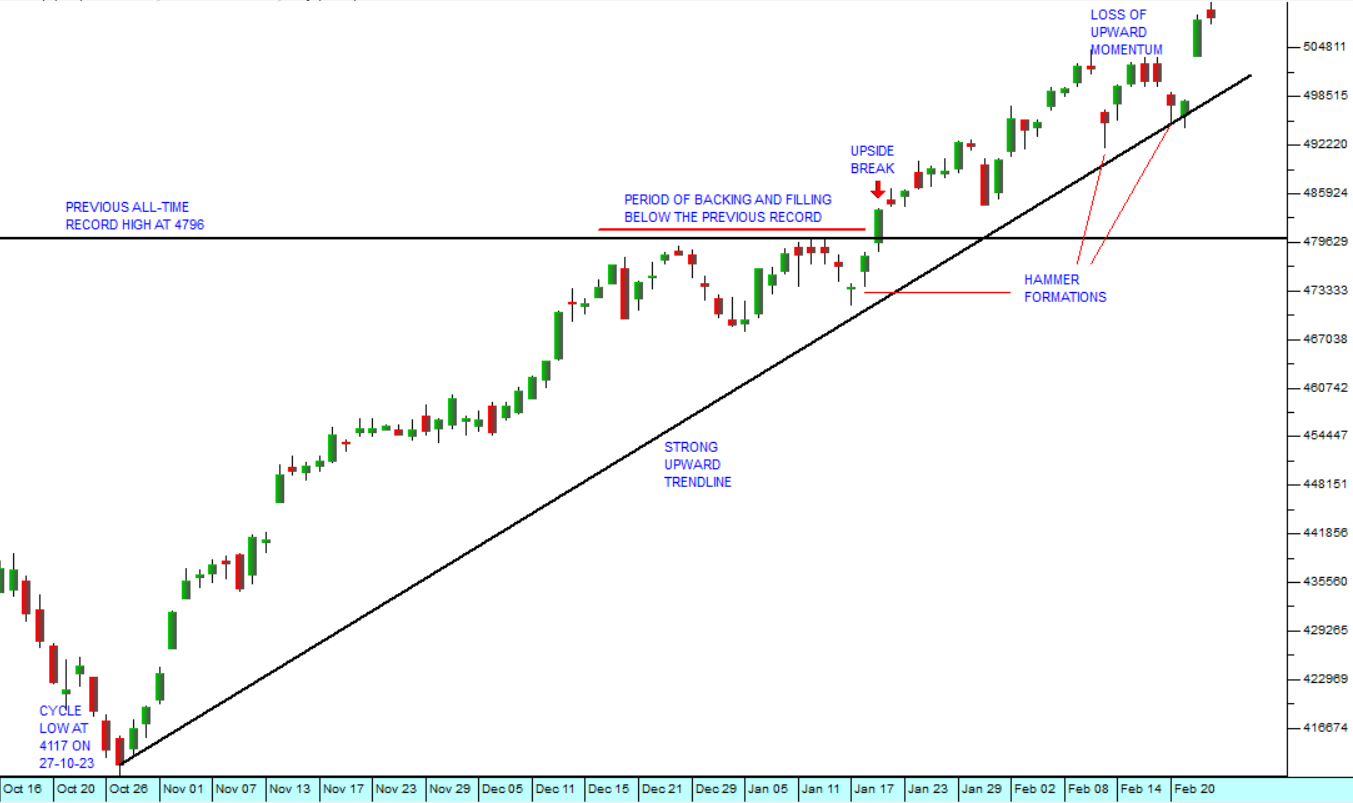
Immediately after the Viceroy report was published, Steinhoff fell from around R55 to below 465c and hovered there for just over a week. Then it began to rally, reaching as [glossary_exclude]high[/glossary_exclude] as 860c. This is a classic “bull trap”. Excited private investors jump in thinking the bad news is all discounted and the company cannot possibly have wiped out a net asset value of over R56 per share.
But there was more bad news to come and those who piled in too early were severely punished. Over the next six months a steady stream of negative reports came out on every aspect of the Steinhoff debacle. Each one of them pushed the share price lower. Its lowest closing price was just 107c reached on 4th June 2018. Consider the chart:
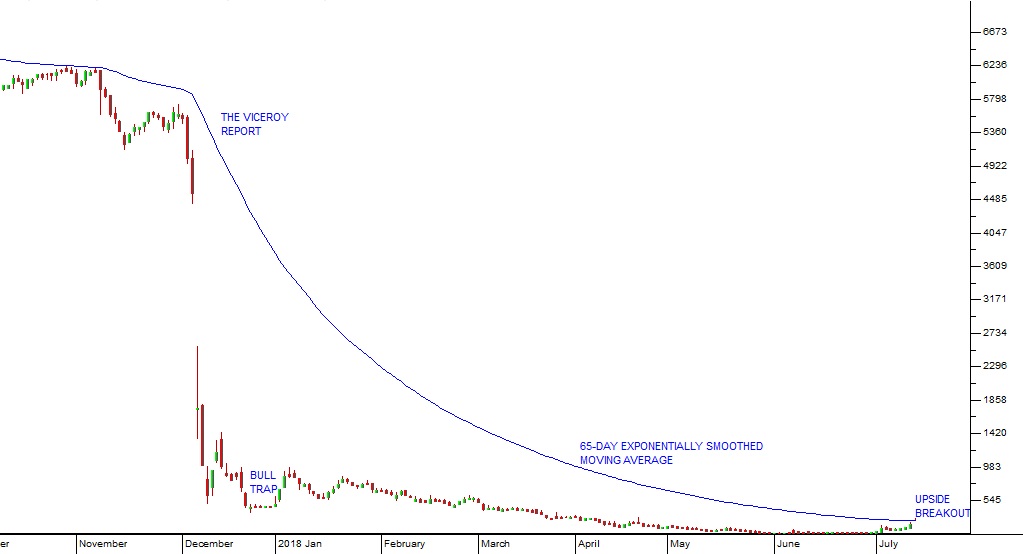
Steinhoff (SNH) October 2017 to July 2018 - Chart by ShareFriend Pro
Here you can see the progress of Steinhoff following the Viceroy report. Our suggestion all along has been to apply a 65-day exponentially smoothed moving average and wait for a clear upside breakout. The 65-day exponential allows time for all the bad news to surface and be aired. Eventually, when some genuine good news comes out there is an upside breakout. For Steinhoff, that came in the form of its negotiations with its creditors for a 3-year relief from litigation to allow the board of directors time to restructure the business. That resulted in the share moving up and breaking above its 65-day exponential (which was by that time at 255c). Yesterday, Steinhoff closed at 288c and we expect it to go higher. But for future reference, when a blue chip share like Steinhoff takes a big hit just apply the 65-day exponentially smoothed moving average – and wait…DISCLAIMER
All information and data contained within the PDSnet Articles is for informational purposes only. PDSnet makes no representations as to the accuracy, completeness, suitability, or validity, of any information, and shall not be liable for any errors, omissions, or any losses, injuries, or damages arising from its display or use. Information in the PDSnet Articles are based on the author’s opinion and experience and should not be considered professional financial investment advice. The ideas and strategies should never be used without first assessing your own personal and financial situation, or without consulting a financial professional. Thoughts and opinions will also change from time to time as more information is accumulated. PDSnet reserves the right to delete any comment or opinion for any reason.
Share this article:
_art4mAy24.png)