Stadio’s Shooting Star
12 October 2017 By PDSNETThe ancient Japanese charting method known as “candlestick charting” in the West predates Charles Dow (the “father” of technical analysis) by several centuries. It contains some very simple and useful wisdoms which private investors would be well-advised to follow. The recent listing of Stadio on the JSE gives an excellent example of what the Japanese call a “shooting star”. This share came to the market in a flurry of very positive news reporting and was universally described as the next Curro Holdings – run by the same man that made Curro famous (CR van der Merwe) and backed by the same parent company (PSG). All this hype caused the share price to race upwards – for the first four days – reaching a ridiculous price of 950c on the 4th day (10-10-2017). After this the price collapsed back to close at 816c. This makes a perfect “shooting star” candle where the upper shadow (the vertical line above the green “body”) is twice as big as the body of the candle. The upper shadow was 134c (i.e. the 950c high minus the 816c close) and the body was 66c (816c-750c). Look at the chart:
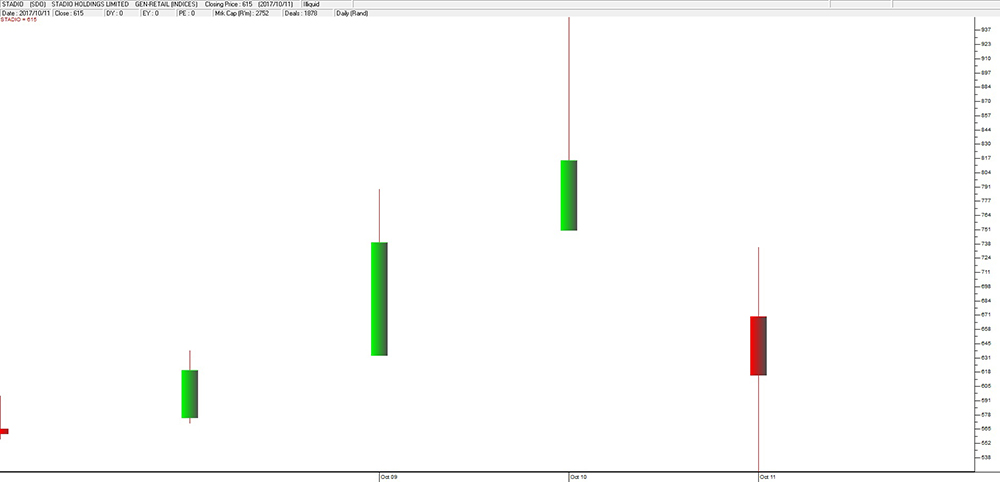
Stadio (SDO) Share Price - Chart by ShareFriend Pro
A shooting star is almost always comes at a cycle top and is followed by a downtrend. The psychology of this is that there was excessive enthusiasm for Stadio, because of all the media hype and the previous example of Curro. That excessive optimism took the share well above its true value and when it ran out of steam it collapsed back to 816c before the market closed on 10th October 2017. The next day the bears took over and pushed the share price down a massive 26%, to below 600c - which leaves one poor optimist still clutching the shares he paid 950c for in complete bewilderment. The Japanese say that each day on the market is a battle between the bulls and the bears. The battle is either won by the bulls (it closes above its open - a green candle) or lost (it closes below its open - a red candle). A shooting star shows that the bulls were simply [glossary_exclude]unable[/glossary_exclude] to sustain the upward trend – they had advanced too early too far. They could not hold on to their gains. And once they fell back, the bears dominated. Of course, we have previously advised that you should never plunge into a new listing – no matter what the press is saying or what you may think about the company. Rather watch what the market does with the share and get a feel for how other investors feel and how they are valuing it. Remember, there will almost always be some shareholders who got the shares before the listing and don’t really want to keep them. They are known as the “stags”. You should only think about buying in when you are sure that they have mostly sold out. If you are interested in learning more about candlestick charting, we [glossary_exclude]offer[/glossary_exclude] two comprehensive lecture modules, which you can now purchase individually from our course - Click here. If you are already a student of ours, please refer to lecture module 27 and lecture module 28.DISCLAIMER
All information and data contained within the PDSnet Articles is for informational purposes only. PDSnet makes no representations as to the accuracy, completeness, suitability, or validity, of any information, and shall not be liable for any errors, omissions, or any losses, injuries, or damages arising from its display or use. Information in the PDSnet Articles are based on the author’s opinion and experience and should not be considered professional financial investment advice. The ideas and strategies should never be used without first assessing your own personal and financial situation, or without consulting a financial professional. Thoughts and opinions will also change from time to time as more information is accumulated. PDSnet reserves the right to delete any comment or opinion for any reason.
Share this article: