S&P500 Support
Investors have been nervously watching the progress of Wall Street against the background of mounting allegations against Donald Trump and senior members of his staff, and the “trade war” which he has instigated against China. At the same time, investors are also concerned that the continuing strength of the US economy will result in a more rapid increase in interest rates going forward.
The effect of this nervousness has been to take the S&P500 index into a correction from its all-time high of 2930 made on 20th September 2018. The fears usually associated with October month are now well behind us and it is unusual for markets to be in a corrective phase over the festive season – but then the political situation in America is nothing if not unusual.
The only reliable mechanism for assessing the risks in such a convoluted and constantly shifting situation is technical analysis. Here the investor makes the bold assumption that the insiders, the people who really know what is actually happening, will trade on their knowledge and thus the direction of the market will give at least an indication of what is to come. Consider the chart:
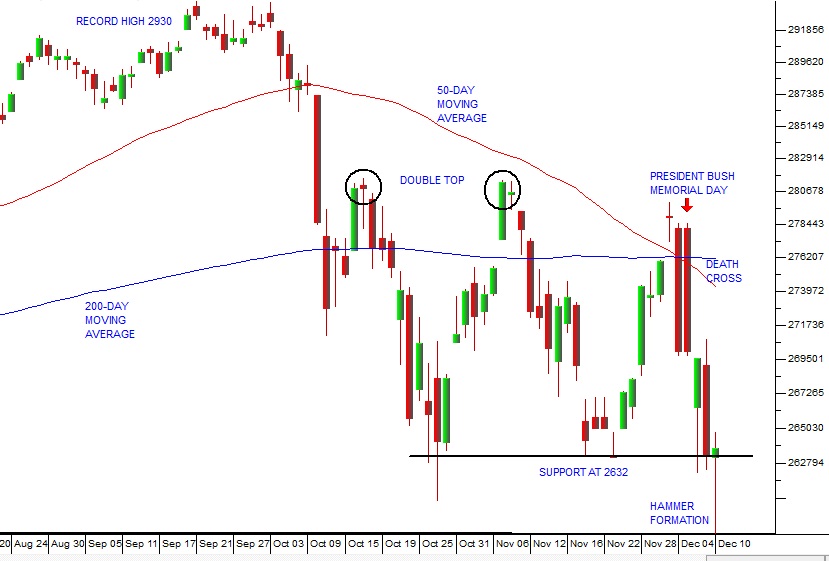
S&P500 Index August to December 2018 - Chart by ShareFriend Pro
The chart begins with the all-time record high of 2930 made on 20th September 2018. This is followed by a 10% correction which takes the S&P down to roughly 2632. Since then it has been moving up and down between resistance at around 2810 (see the “double top” formation) and support at roughly 2632. The memorial holiday for President Bush is shown by a duplicate candle as the market fell heavily back to its support line. You will notice the “death cross” where the 50-day moving average cuts down through the 200-day moving average. This event is supposedly an indication of the start of a bear trend, but over the 9 years of the current bull trend, there have been four previous death crosses which were not followed by a [glossary_exclude]bear[/glossary_exclude] trend. We suggest that the current situation is no different. The final technical indicator is the “hammer” formation which occurred last night on the S&P500. This formation is taken from Japanese candlestick charting where every trading day is regarded as a battle between the bulls and bears. The green candles are days when the bulls won the day, and the red candles where the bears won. A hammer formation shows an epic battle where the bears managed to drive the market way down to new lows, but could not hold that position and were forced by the bulls to give up all their gains. This results in a candle with a very small “body” and a very long “tail” – such as occurred on the S&P last night. Hammer formations are almost always followed by a strong upward trend and usually mark the bottom of at least a short-term cycle. We believe that, because of the fundamental strength of the US economy, the support at 2632 will hold and that the market will now move up off this base. If we are wrong and the S&P closes below 2632 in the coming weeks, then that signals a resumption of the correction, but we see that as unlikely.← Back to Articles