S&P500 Going to 3506
19 July 2019 By PDSNETIn December 2016 we wrote an article on the use of a Point and Figure (P&F) horizontal count to forecast the future of the S&P500 index. At the time, the S&P had been in a long sideways pattern which made a good horizontal count possible once there was an upside breakout. In our article, we published this P&F chart to explain the count:
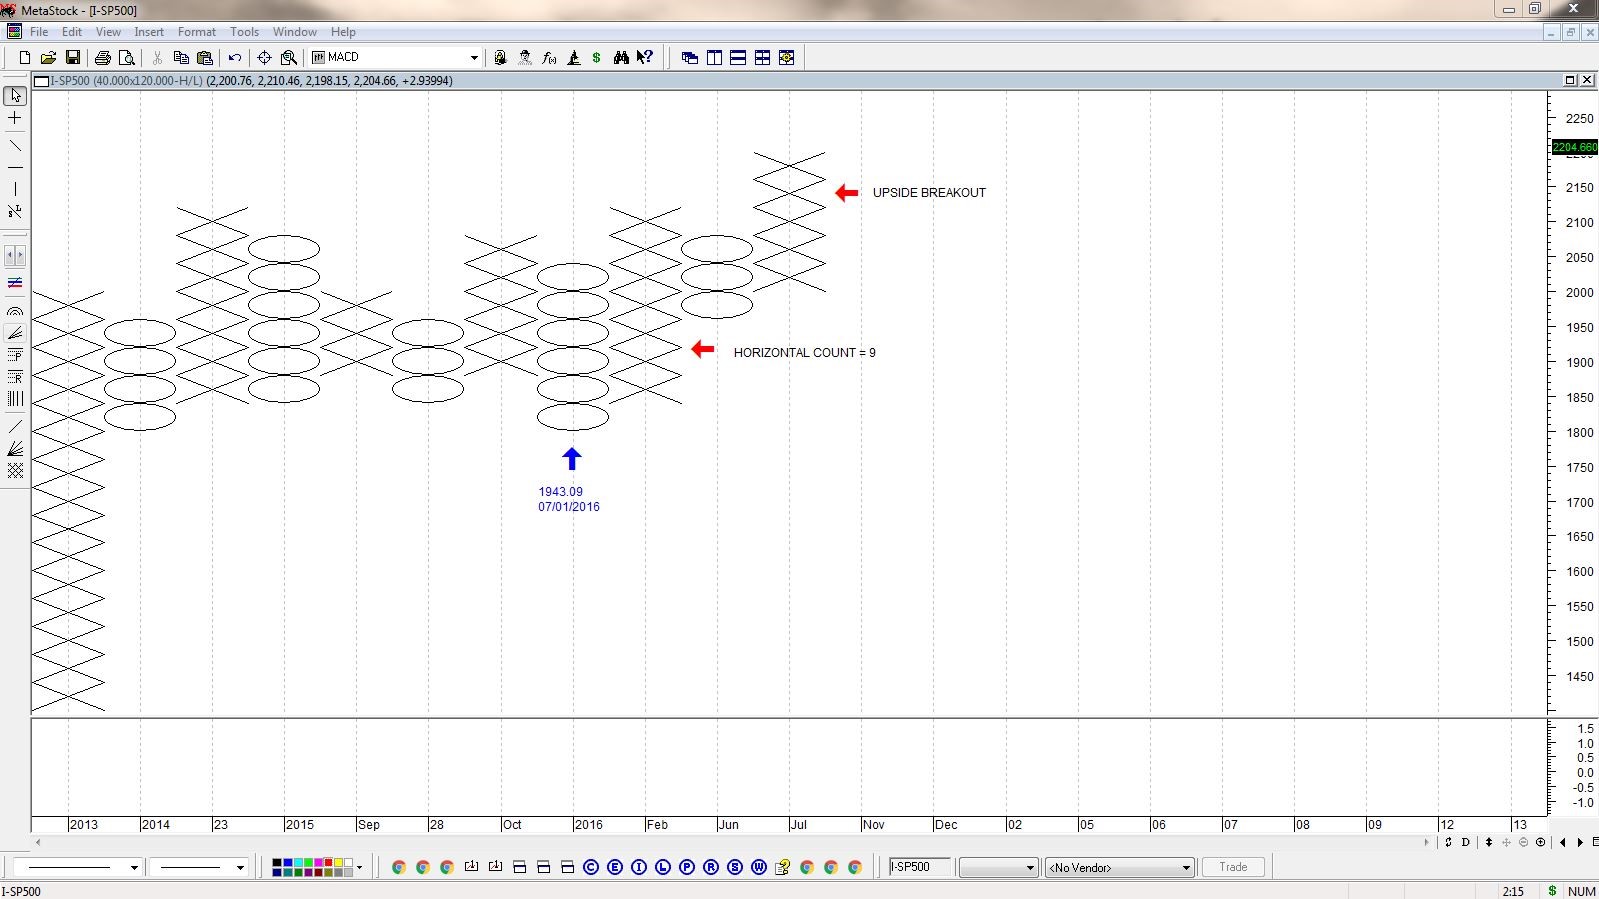
P&F is a one-dimensional chart (it has no time dimension like normal charts) so this chart shows data from November 2014 to December 2016 which enabled a horizontal count of 9 and predicted that the S&P would rise to 3027 from its position at the time of just below 2200 (i.e. a 38% rise).
Today that prediction has almost been fulfilled with the S&P reaching a record high of 3014 on 15th July 2019.
Now we are in a position to make another prediction based on the sideways movement of the S&P over the past 18 months. This prediction is not as strong as the previous one because the sideways movement has not been as consistent – which means that we can only get an unbroken horizontal count of 5. Nonetheless, it predicts that the S&P500 will rise to at least 3506 – an increase of 17% from where it is now.
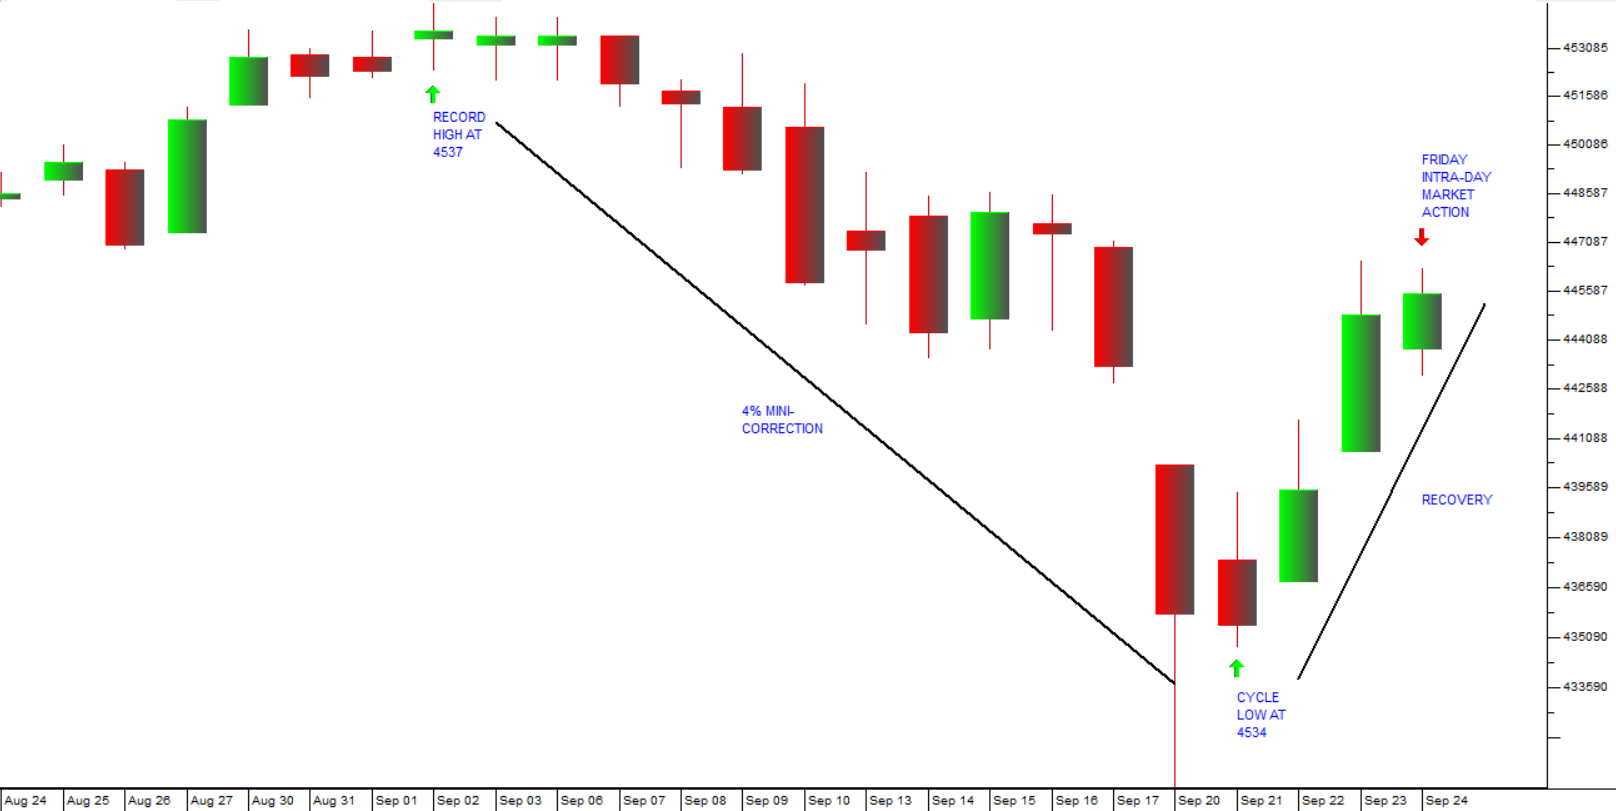
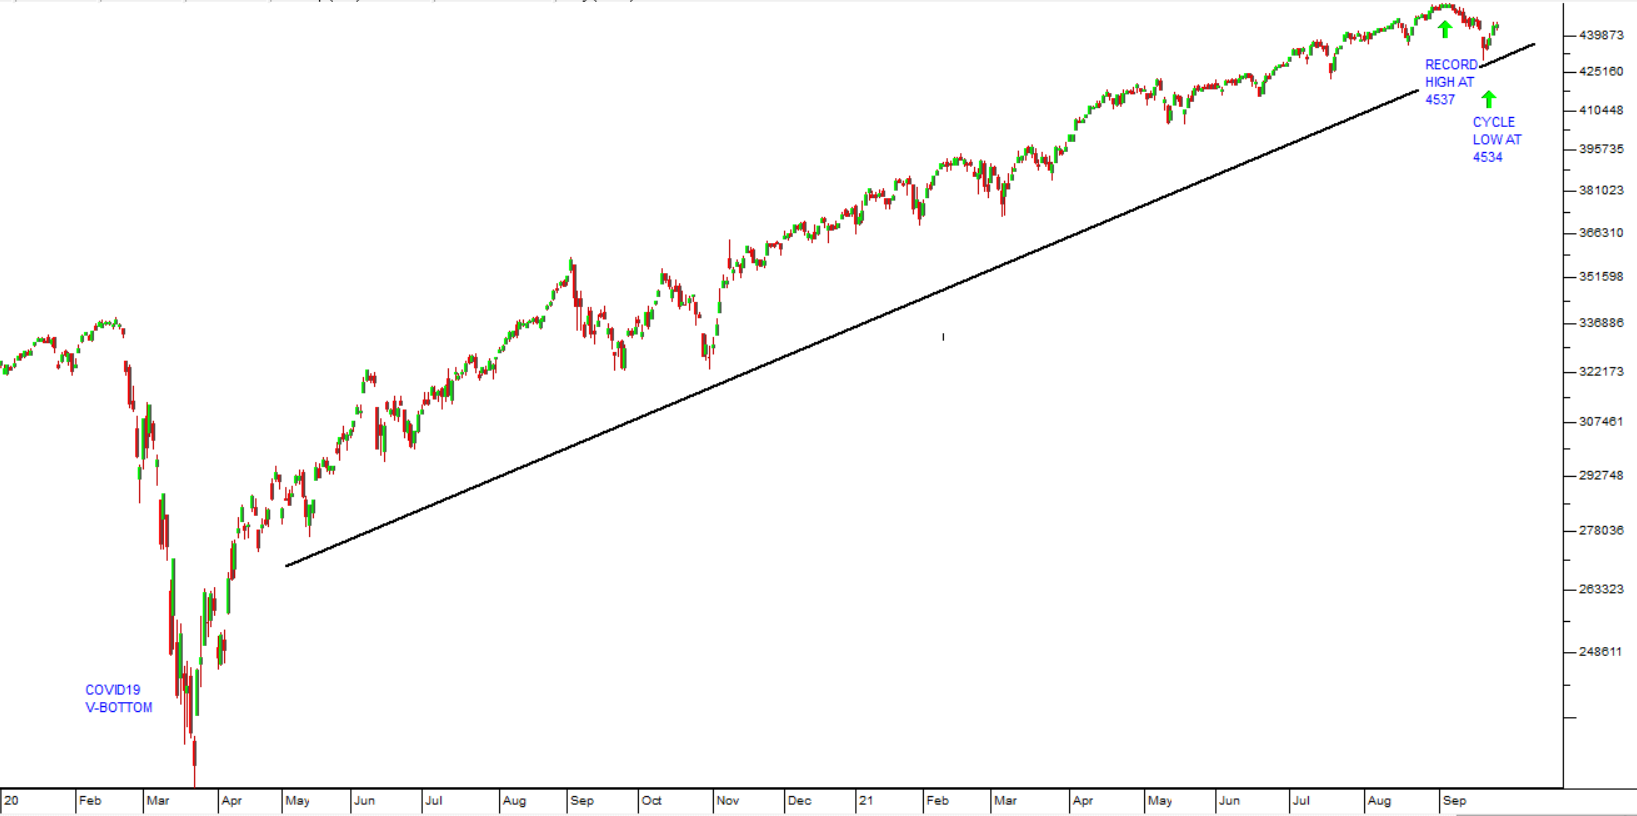
The chart below is a standard candlestick chart showing the two periods used for the horizontal counts mentioned:
The latest horizontal count (taken from MetaStock) looks like this:
In this horizontal count, we found that a box size of 77 was best. The low point for the S&P’s sideways pattern was 2351 on 24th December 2018. This gave us the following calculation for the upside target:
(3 X 77 X 5) + 2351 = 3506
Both of these forecasts were made using a 3-point reversal size.
Of course, we should also make the point that horizontal counts are inevitably conservative. In other words, they usually in our experience tend to under-estimate the upside target.
Refer to Module 28 in the PDSnet Online Investment Course for a detailed explanation of Point and Figure charting.
DISCLAIMER
All information and data contained within the PDSnet Articles is for informational purposes only. PDSnet makes no representations as to the accuracy, completeness, suitability, or validity, of any information, and shall not be liable for any errors, omissions, or any losses, injuries, or damages arising from its display or use. Information in the PDSnet Articles are based on the author’s opinion and experience and should not be considered professional financial investment advice. The ideas and strategies should never be used without first assessing your own personal and financial situation, or without consulting a financial professional. Thoughts and opinions will also change from time to time as more information is accumulated. PDSnet reserves the right to delete any comment or opinion for any reason.
Share this article: