Silver on the move?
26 July 2020 By PDSNETOne of our clients, Mr. Koot Jordaan, drew our attention to the fact that the rand price of silver, which has been underperforming gold since 2011, may be making an upside breakout.
Mr. Jordaan suggested that silver in both rands and US dollars had been moving in an extended sideways pattern. Consider the charts:
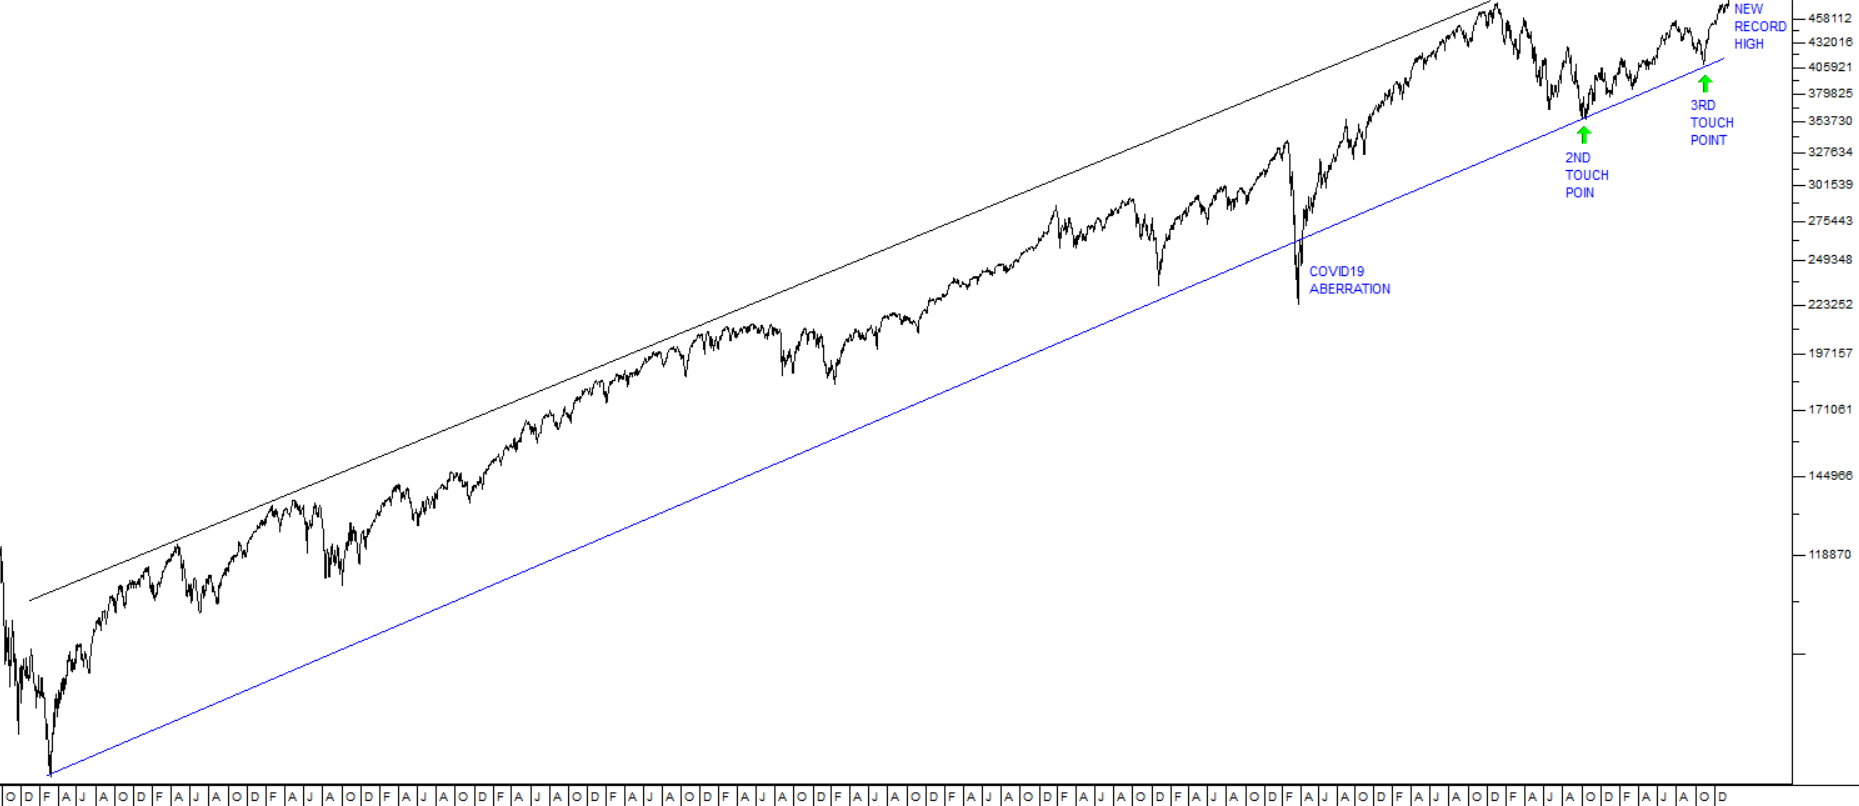
Silver in US dollars
(We regard the downward break in March 2020 in the US dollar chart as an aberration.)
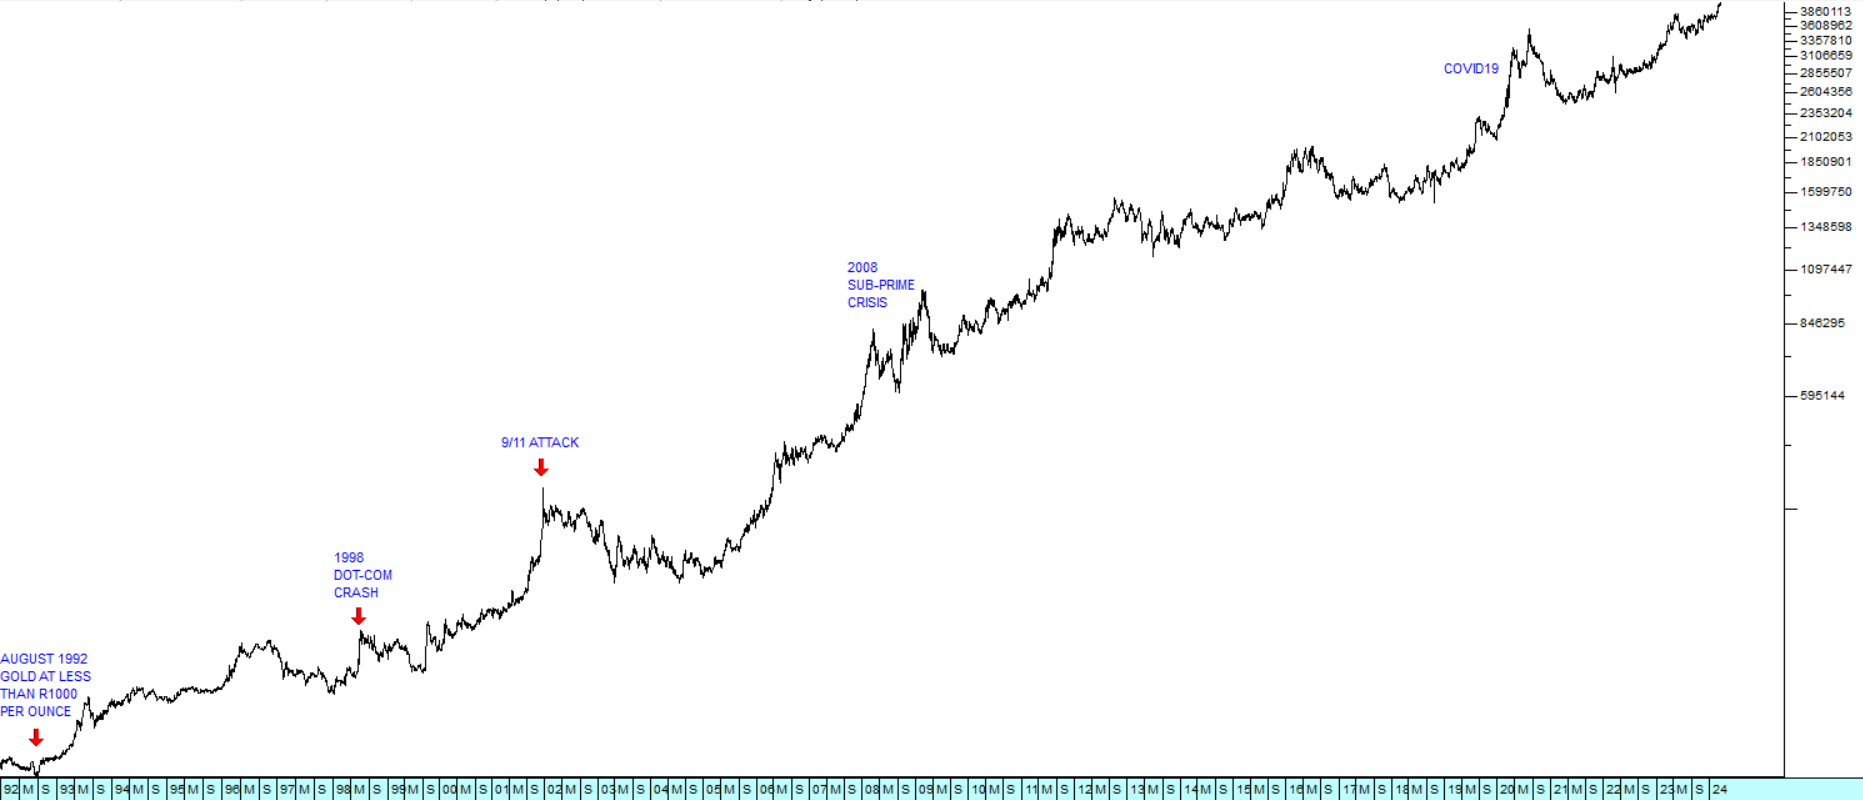
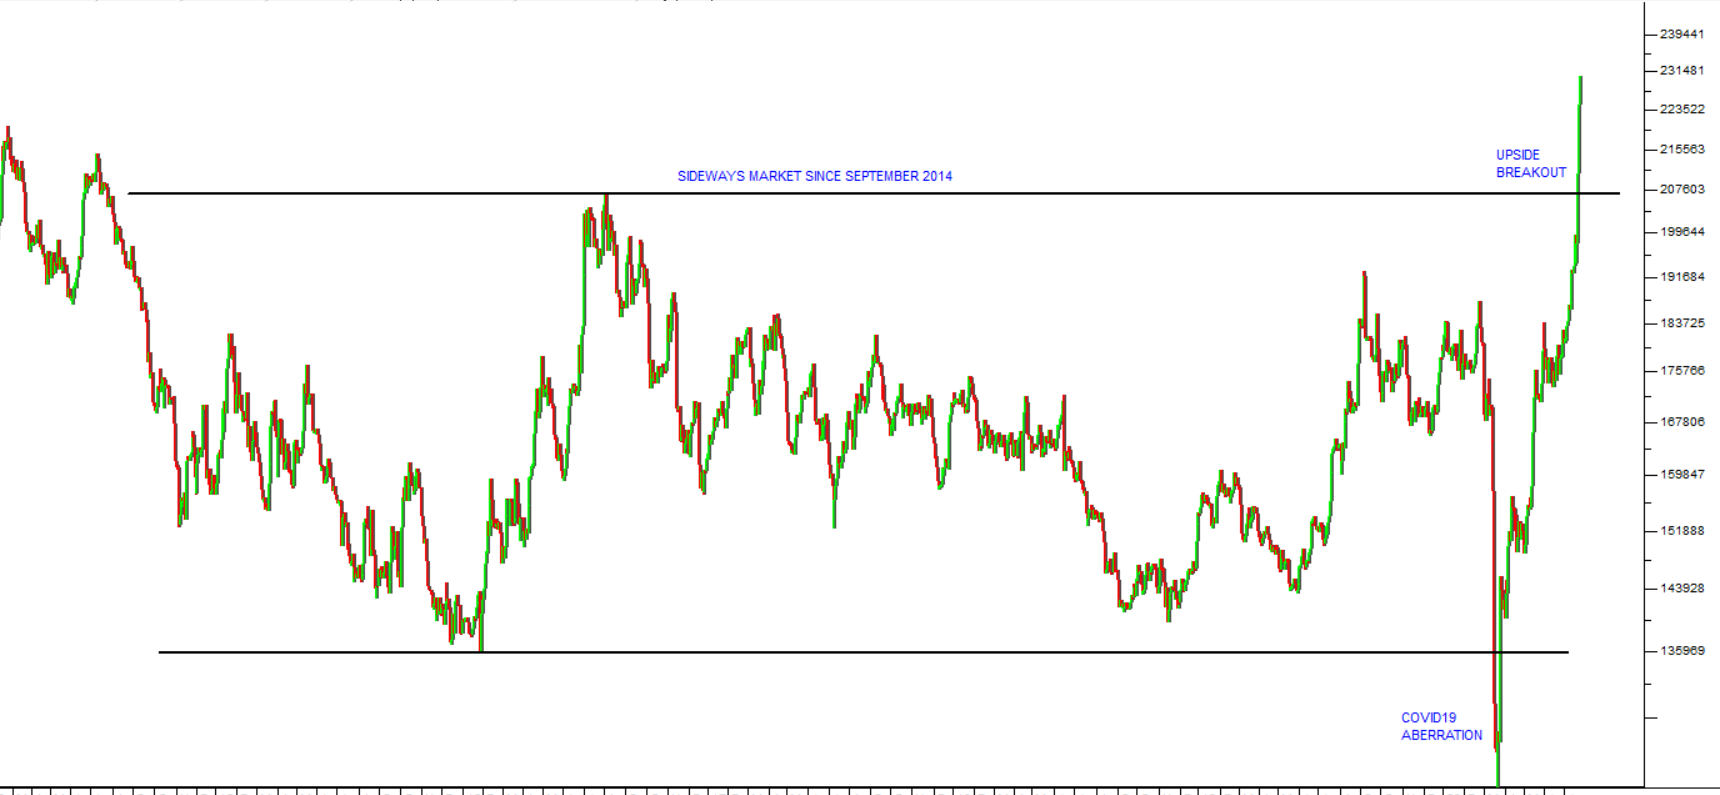
Silver in rands
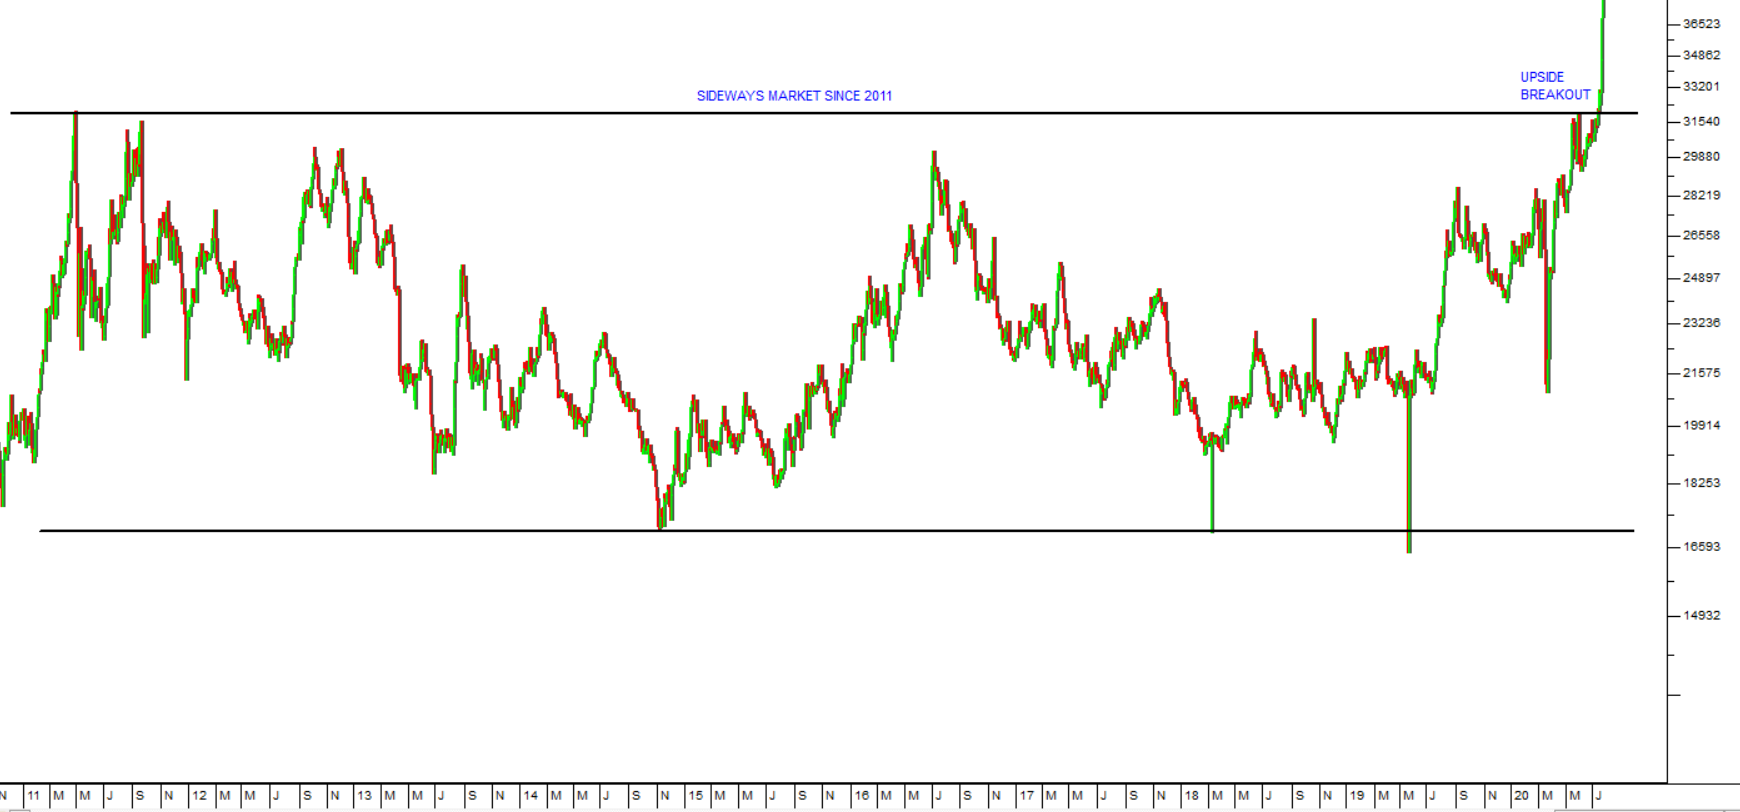
You can see here that silver has been moving sideways in US dollars since September 2014 and in rands since 2011. Both charts also show an upside breakout in the last week or so.
Sideways markets like this are periods of consolidation. The price is “backing and filling” while it waits for new direction. The longer the sideways pattern continues, the further up the price will go once there is a clear upside breakout. That is the basis for the horizontal count method of point and figure (P&F) charting.
If you are unsure about horizontal counts in P&F refer to our article No. 49 “Upside Target” published in December 2016. https://www.pdsnet.co.za/
Using Metastock, we tried various box sizes to find an unbroken horizontal count. The following charts show our results:
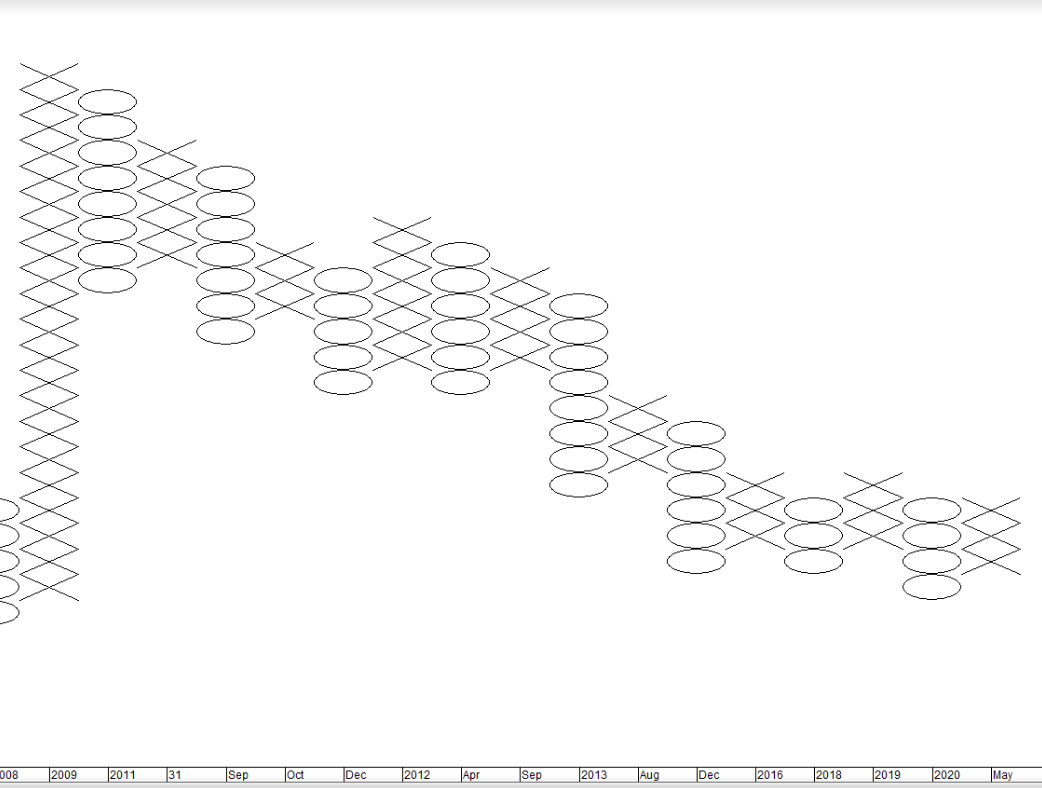
Silver in US dollars
Silver in rands
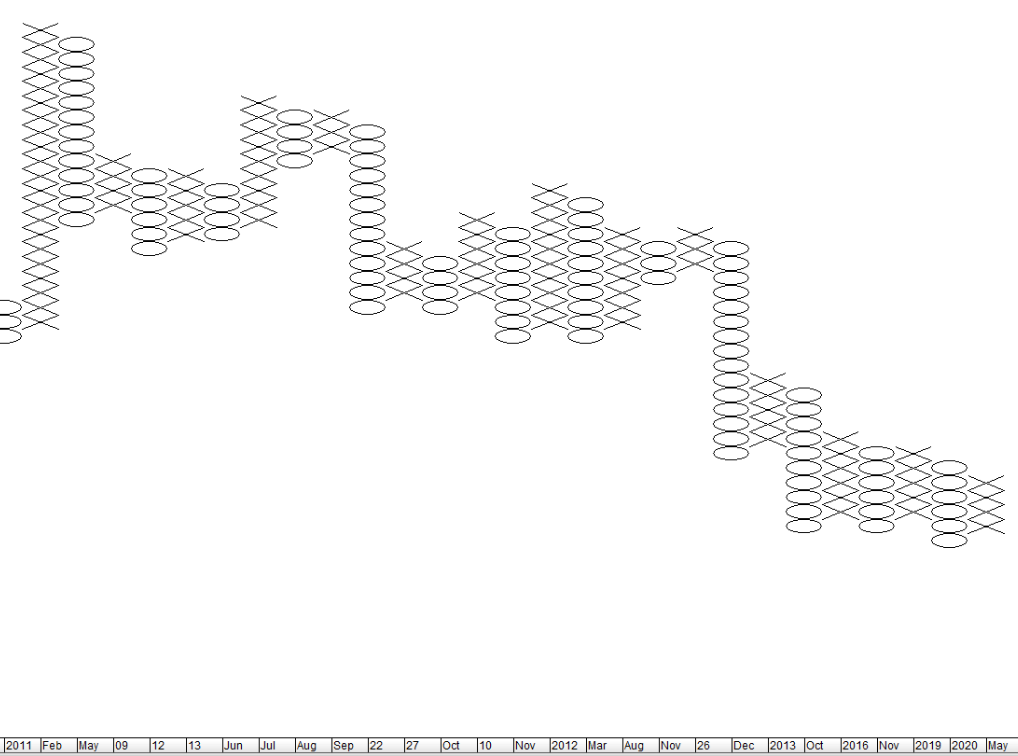
In both charts you can see there is an extended sideways pattern in the most recent years with an unbroken horizontal count of 6 in each case.
In US dollars, the horizontal count gives an upside target of $45.92 – more than double its current price.
Mr. Jordaan points out that historically it is normal for gold to move before silver. So, it is entirely possible that in the next few weeks, silver will catch up with gold as it has done in the past.
The only problem is that while both the rand and the US dollar line charts show an upside break, neither yet shows that break in P&F – which is necessary for the horizontal count target to be valid. Valid horizontal count targets in P&F are more than 70% accurate and usually conservative in our experience.
DISCLAIMER
All information and data contained within the PDSnet Articles is for informational purposes only. PDSnet makes no representations as to the accuracy, completeness, suitability, or validity, of any information, and shall not be liable for any errors, omissions, or any losses, injuries, or damages arising from its display or use. Information in the PDSnet Articles are based on the author’s opinion and experience and should not be considered professional financial investment advice. The ideas and strategies should never be used without first assessing your own personal and financial situation, or without consulting a financial professional. Thoughts and opinions will also change from time to time as more information is accumulated. PDSnet reserves the right to delete any comment or opinion for any reason.
Share this article: