Resilient
23 April 2018 By PDSNETOn the 21st of February this year we wrote an article about Resilient and urged you to apply a 65-day exponentially smoothed moving average (65-day E) to get a useful buy signal. At that time the share was at R78 and the 65-day E was at R120.
Since then there has been much written in the press about Resilient and it has become even more difficult for the private investor to ascertain exactly what is happening or what the truth is about the company.
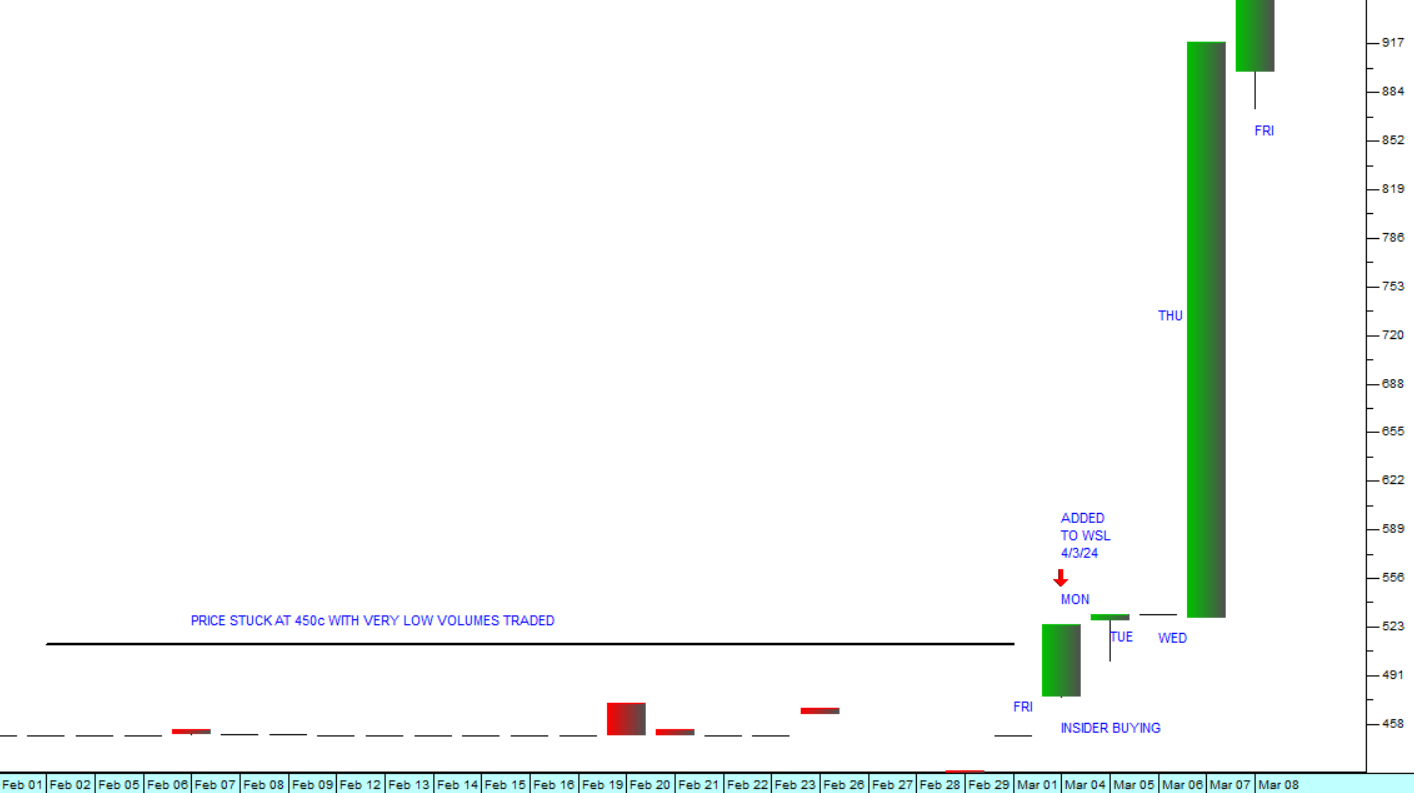
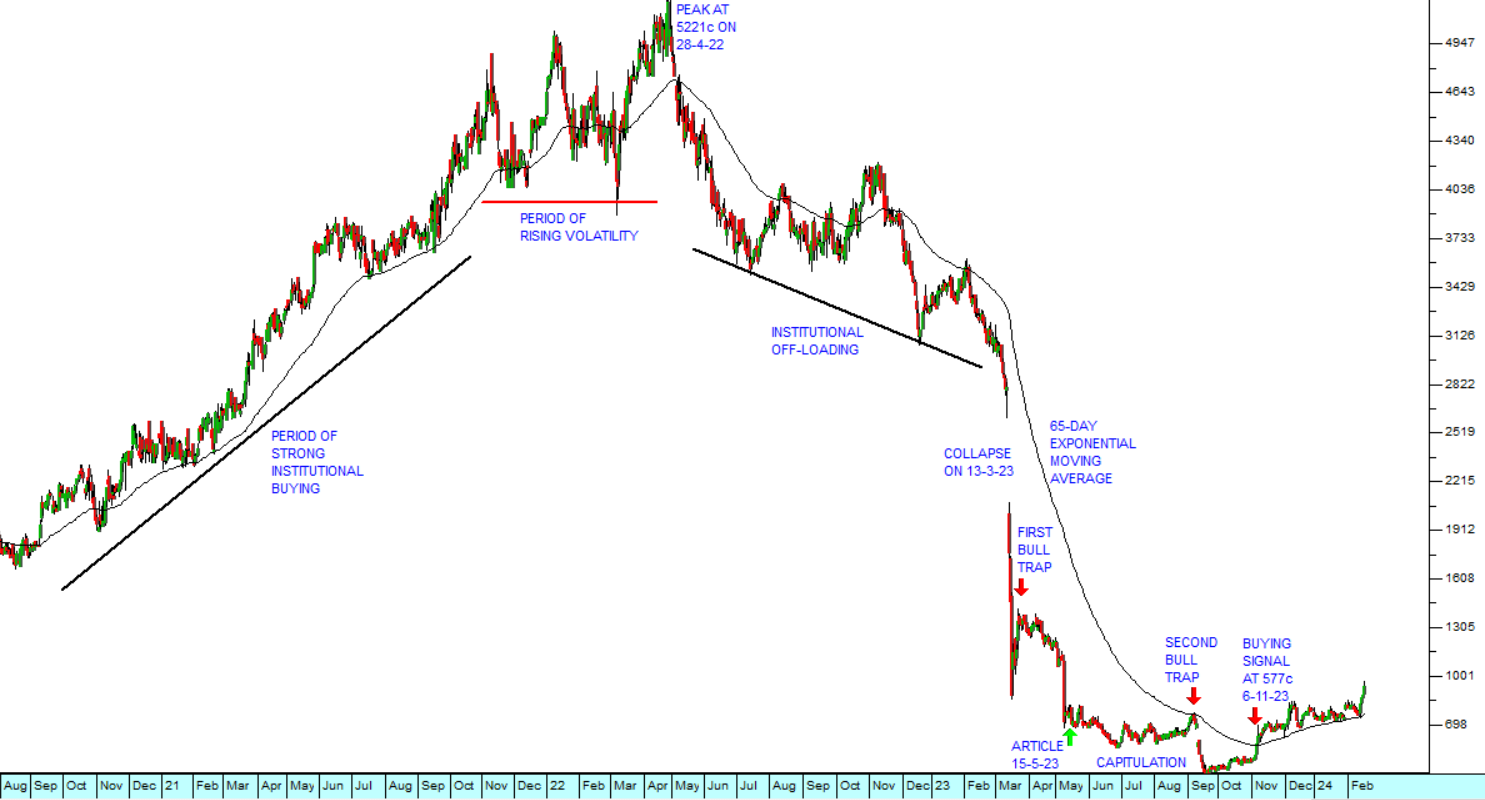
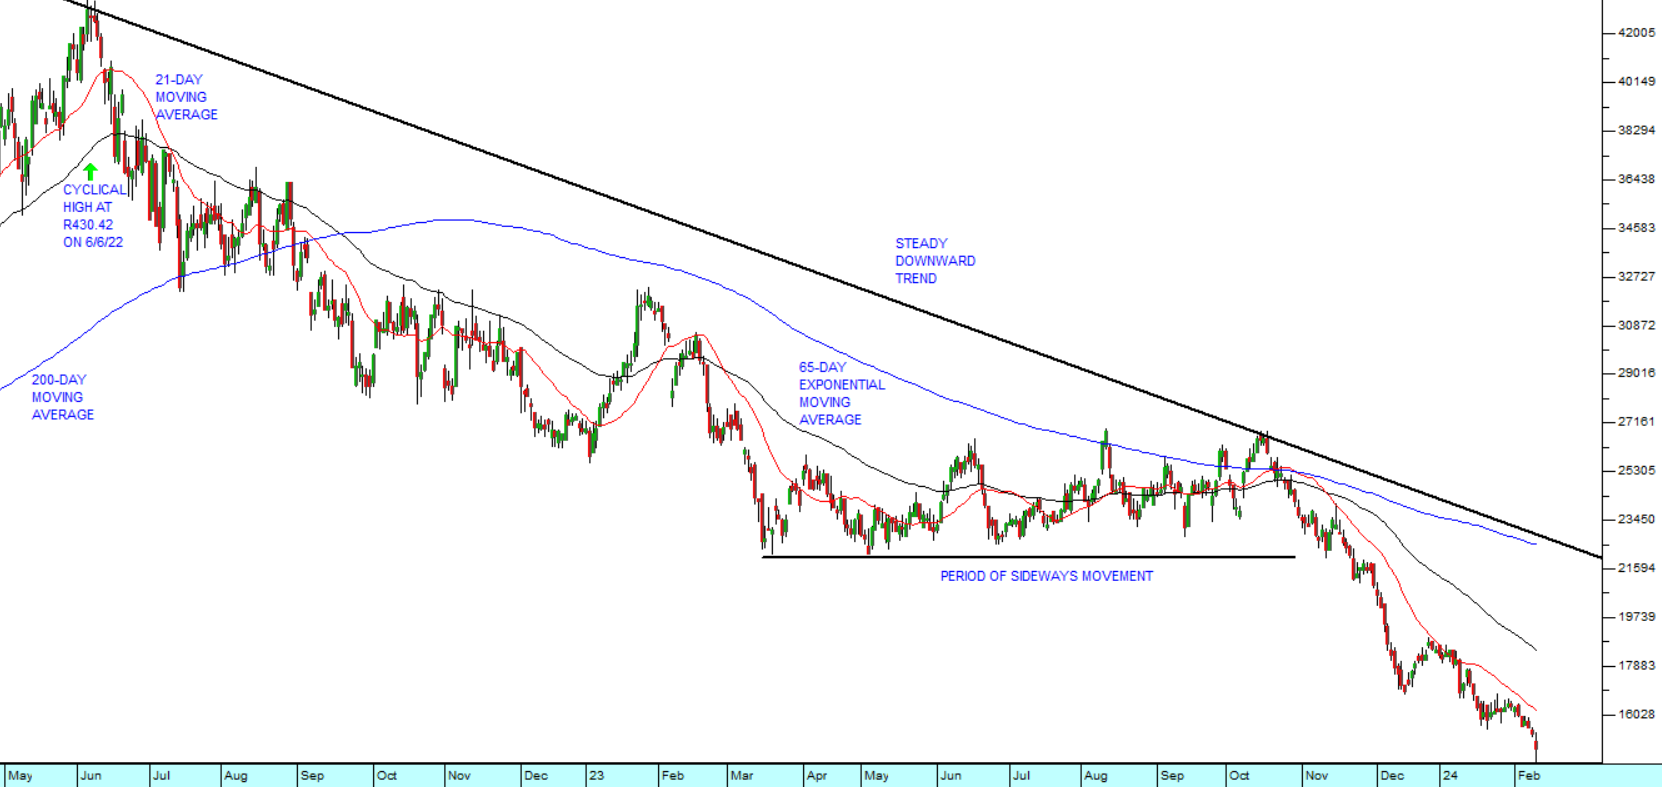
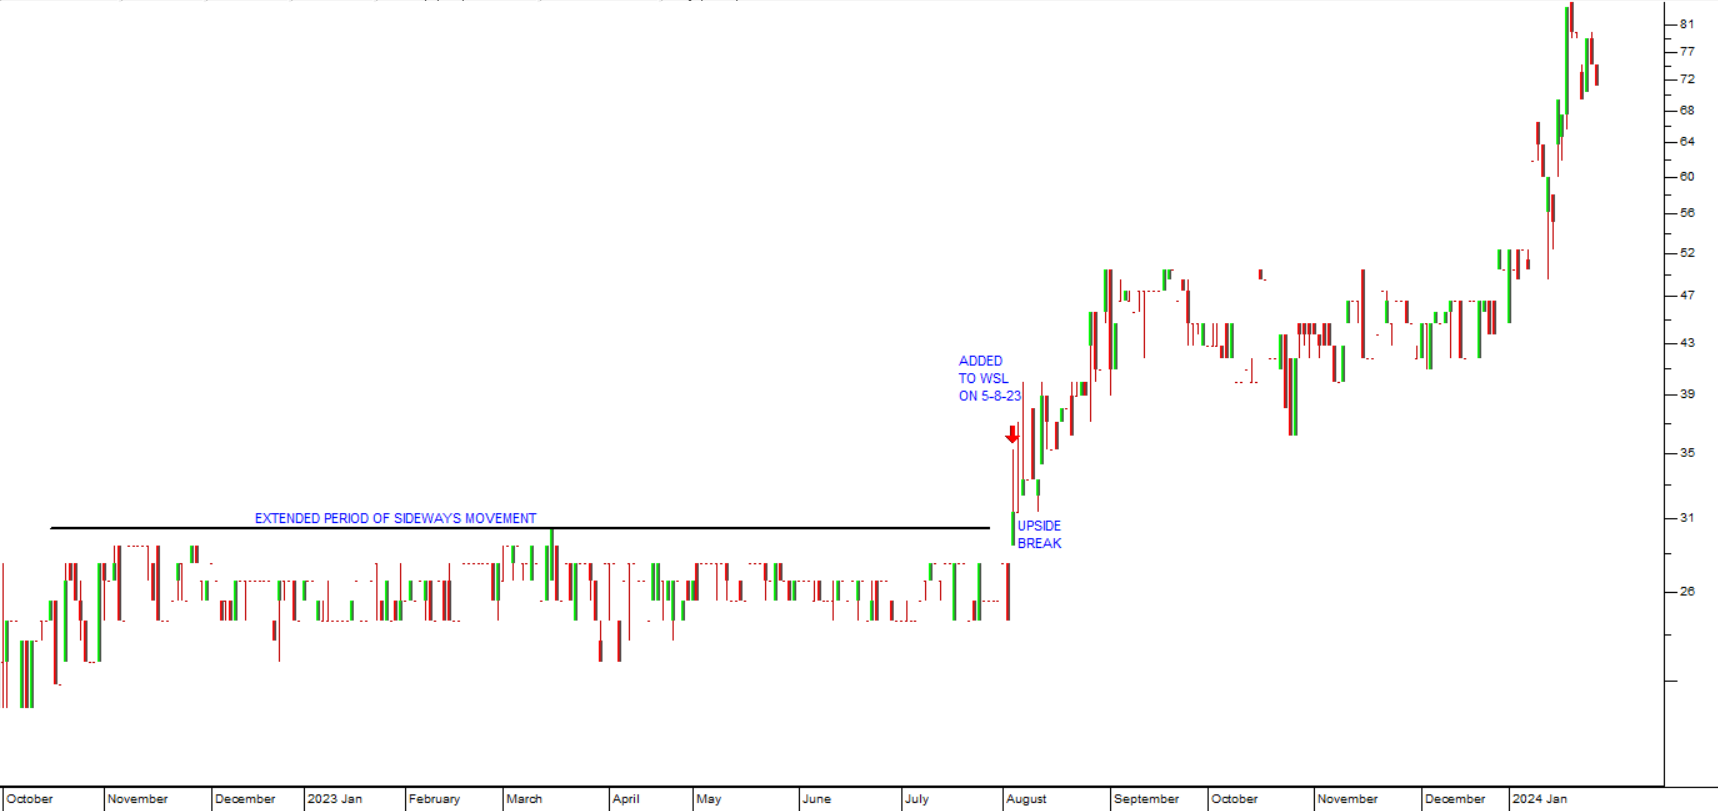
The great benefit of technical analysis in all its various forms is that it allows the private investor to see what the insiders, who know what’s going on, are doing. Insiders always tend to trade on the special information which they have – and that trade is almost always visible in the share’s price (and volume) pattern. Consider the chart:
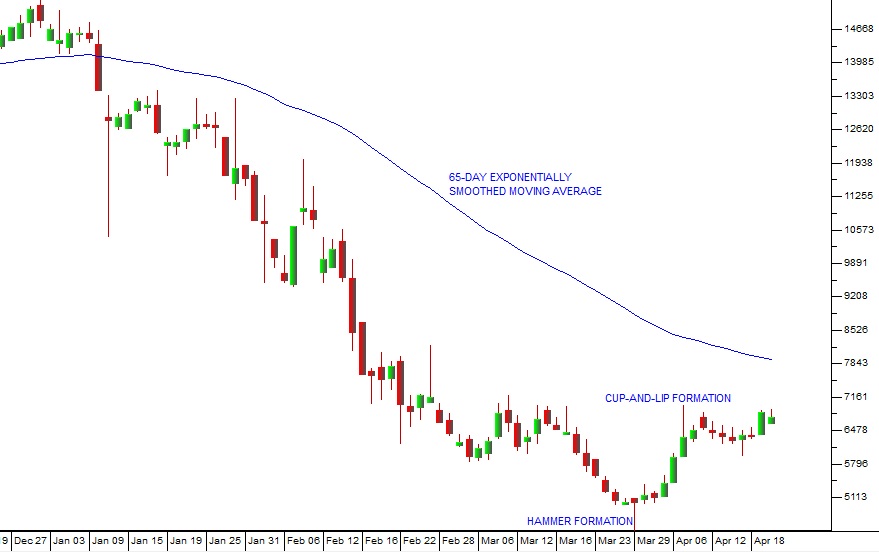
Resilient (RES) - Chart by ShareFriend Pro
The benefit of the 65-day E is that it allows time for all the relevant news to emerge and be assimilated by the market. When a blue chip collapses, this moving average moves down steadily until the playing field is again level and everything of importance is known. Usually, by that time, the 65-day E has fallen quite close to the current price and so an excellent buy signal is given when the share finally begins to move back up. You will note how the 65-day E has flattened out and is not falling as quickly. This is an early sign that the buy signal is imminent. You will also note the “hammer” candle on 29 March 2018 – which marked, as it often does, the exact bottom of the trend. Hammer [glossary_exclude]formations[/glossary_exclude] are an ancient Japanese formation which show that the bears tried to take the share down to new low levels, but were unsuccessful. It is a very bullish formation and almost always comes at the exact bottom of a trend. Then there is a cup-and-handle formation appearing. The cup has its bottom at the hammer and the handle which follows is a far more shallow formation – that is now almost complete. The cup-and-handle formation was first identified by William O’Neil of the [glossary_exclude]Investors[/glossary_exclude] Business Daily in America. It is also a very bullish formation. So now the stage is set for an upward move on Resilient – all the signs are there and as a private investor you have to decide whether you will wait for the buy signal on the 65-day E or move more quickly. You can also decide that none of these indications are worth anything. The choice is yours – but we believe that Resilient will soon begin to move back up towards its previous heights. Just remember:Investment is not about certainties – it is about probabilities
All we are talking about is the probabilities and we can still be wrong.DISCLAIMER
All information and data contained within the PDSnet Articles is for informational purposes only. PDSnet makes no representations as to the accuracy, completeness, suitability, or validity, of any information, and shall not be liable for any errors, omissions, or any losses, injuries, or damages arising from its display or use. Information in the PDSnet Articles are based on the author’s opinion and experience and should not be considered professional financial investment advice. The ideas and strategies should never be used without first assessing your own personal and financial situation, or without consulting a financial professional. Thoughts and opinions will also change from time to time as more information is accumulated. PDSnet reserves the right to delete any comment or opinion for any reason.
Share this article: