Oil

21 September 2020 By PDSNET

The Oil market is usually an excellent barometer of the state of the world economy. When there is growth, people buy more cars and drive more, more products are consumed which means they have to be transported to retail outlets – usually by an internal combustion engine of some sort.

The COVID-19 pandemic caused the oil price (North Sea Brent) to collapse to prices below $20 a barrel as lockdowns around the world cut vehicle usage sharply. As the worldwide wave of lockdowns subsides, the demand for oil has been picking up. In fact, at the end of August 2020, North Sea Brent was back trading above $45.

Then the price suddenly collapsed back to below $40, just as the Organization of Petroleum Exporting Countries (OPEC) was hosting its annual meeting in Baghdad – online this time. It appears that demand for oil has been lower than was expected. In the United States, the driving season (summer) is now almost over and fuel sales are still down about 20% from last year. In China and India, who are both significant users of oil, demand is also down by about a fifth.

It is apparent that following the pandemic, businesses and individuals have found ways to travel less. Business meetings are being held remotely online and thousands of consumers are now working from home in a trend which is unlikely to be reversed. At the same time, the move to electric cars and trucks is slowly gaining momentum. It is just possible that the drop in oil demand is reflecting a new post-COVID-19 normal.

Of course, OPEC is plagued by a group of its members who persist in reneging on their agreements and supplying more oil to the market than they should. There is also the possibility that Saudi Arabia and other major members of OPEC will arrange for further cuts in production to push the price up. OPEC has now been around for 60 years, but trying to manage a cartel of highly disparate members in the face of weak oil prices is becoming increasingly like trying to herd cats.

Many of the smaller producers in the cartel, like Nigeria and Venezuela, simply cannot survive at $40 per barrel, but they are also usually the ones selling oil above their OPEC quotas. Even the United Arab Emirates (UAE), a staunch member of OPEC, has admitted to selling 20% more than its quota. OPEC recently reduced the flow of oil from 9,7 million barrels per day to 7,7 million, but the actual supply is somewhat more than that and this fall in the price has come despite that restriction.

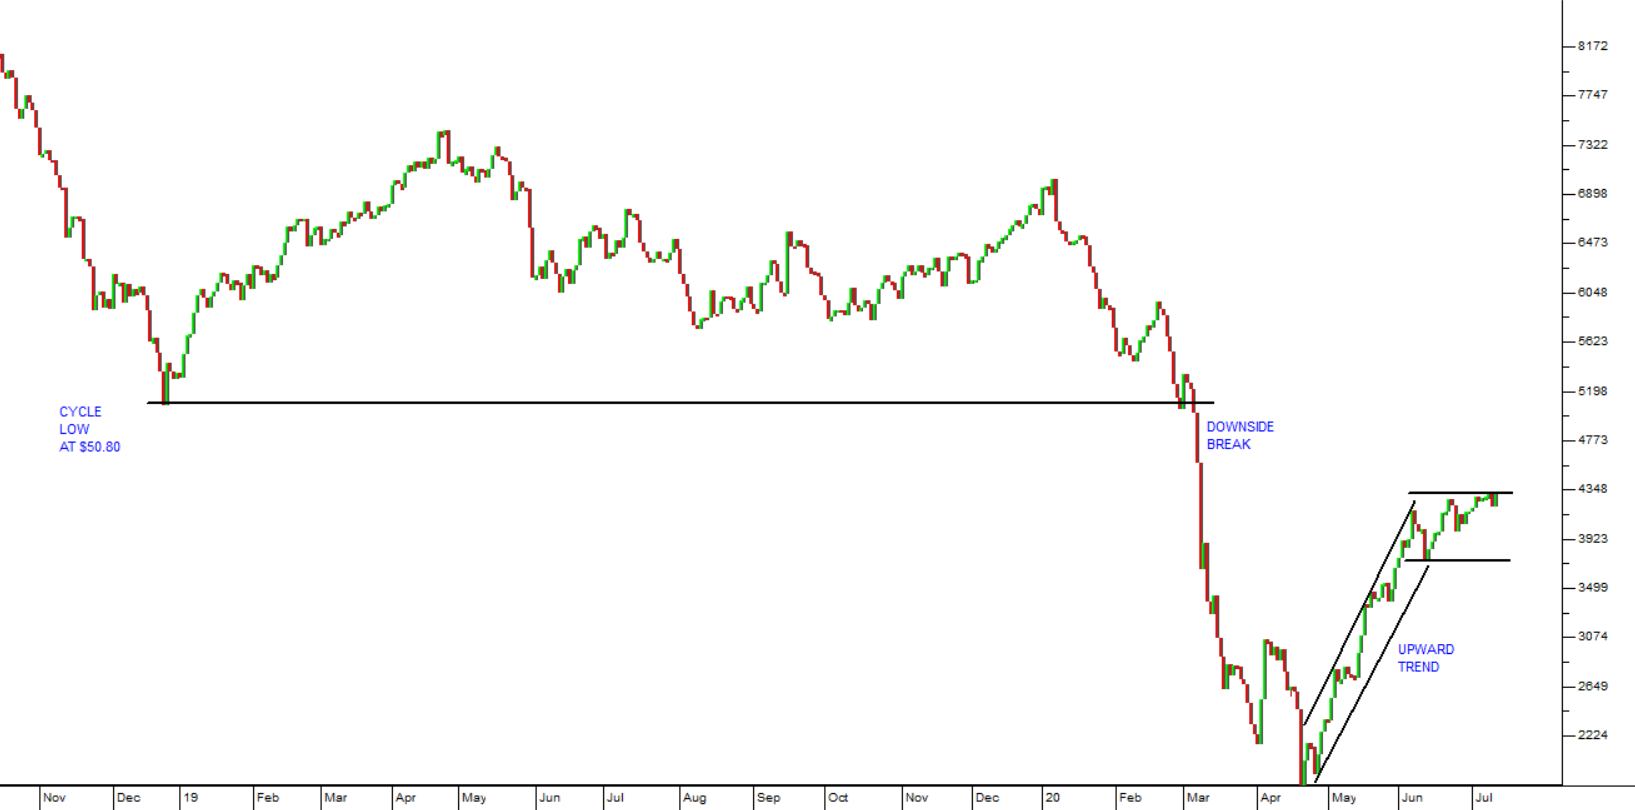
Of course, it is always well to remember that at prices between $40 and $50, shale gas production becomes viable – which tends to place a cap on how high the oil price can go. Rising shale gas production probably accounts for the slowdown in the pace at which the oil price was climbing for the 3 months from the beginning of June to the end of August. Consider the chart:

North Sea Brent Oil: October 2019 to date (20 September 2020). Chart by ShareFriend Pro.

Here you can see the support level at $50.80 per barrel from the previous cycle low - and the downside break which we drew your attention to in our March 2020 Confidential Report. COVID-19 took oil down to a low just below $20 and then it recovered steeply in the second half of April and May 2020. Once the price rose above $40, more and more shale gas producers began to produce again, slowing oil’s advance.

That advance was brought to an abrupt end by a two-week price slump starting on 2nd September 2020. Apparently, oil stores were over-full and off-take was limited by the end of the US driving season. In the last three days oil has recovered somewhat, but is still below the $45.93 high that it made on 25th August 2020.

It is also well to consider the correction taking place on Wall Street at the moment. That has seen the S&P500 fall about 7,3% from its record high of 2580 also made on 2nd September 2020. We know that there are a few oil stocks in the S&P500, but not enough really to account for this downward move.

Nothing in the markets moves in a straight line. There will always be corrections. But we are satisfied that the great bull trend which began in March 2009 is still in progress. So, our view is that this correction should probably be regarded as a buying opportunity.  


DISCLAIMER

All information and data contained within the PDSnet Articles is for informational purposes only. PDSnet makes no representations as to the accuracy, completeness, suitability, or validity, of any information, and shall not be liable for any errors, omissions, or any losses, injuries, or damages arising from its display or use. Information in the PDSnet Articles are based on the author’s opinion and experience and should not be considered professional financial investment advice. The ideas and strategies should never be used without first assessing your own personal and financial situation, or without consulting a financial professional. Thoughts and opinions will also change from time to time as more information is accumulated. PDSnet reserves the right to delete any comment or opinion for any reason.


Share this article:

PDSNET ARTICLES

Capitec Revisited

Our first article on Capitec was published on Monday 19th February 2018. At the time the share was trading for R820.94 and we pointed out that it had established a support level at around R800. We suggested then that this was a share well worth accumulating on weakness as a long-term

Rand Strength

The currency of a country can be compared to the shares of a listed company. If a company is expected to do well and make profits, then its shares will strengthen relative to other shares. If a country is expected to do well and prosper, then its currency will strengthen relative to other currencies.

Investor confidence in

Stefanutti Stocks

The construction industry is a high-risk industry from an investment perspective. Its fortunes are dependent on winning profitable contracts, usually from government or quasi-government organisations like state-owned enterprises (SOE). Projects often take years to complete and involve significant capital outlays. This makes their cash-flow management

Bitcoin's Collapse

We have said previously that cryptocurrencies like Bitcoin cannot be assessed using fundamental analysis – because they have no fundamentals. They have no balance sheet or income statement, and they generate no income for investors. For this reason, they can only be assessed technically - by looking at the charts.

Speculative Opportunity

PDSnet is mainly concerned with teaching private investors about investment and medium to long-term opportunities on the JSE. The foundation of this approach is that South African tax law treats any gain on a share held for longer than 3 years as a capital gain. In other words, holding a share for more than 3 years means that the investor will not be treated as

Scary Government Debt

Just like a household or an individual, a country’s government goes into debt because it spends more than it receives in taxes and other revenue. The important difference, of course, is that governments (unlike households or individuals) can actually create money out of nothing to finance their deficit if they choose to. This is known as quantitative easing (Q/E).

Correction

On the 10th of July 2024, we tweeted (on “X”) that “...some sort of correction is looking more and more likely.” Four trading days later on the 16th of July 2024, The S&P500 index reached its highest point (5667.2) and began that correction. So far, the S&P has fallen 8,5%. Consider the chart:

WeBuyCars - Follow-up

WeBuyCars (WBC) was spun out of Transaction Capital (TCP) and separately listed on the JSE on 11th April 2024 – just over three months ago. Before the listing we published an article on the 8th of April 2024, in which we suggested that the share would be a solid blue-chip

Bell Equipment

We are often asked what prompts us to add a share to the Winning Shares List. The answer is that it is a variety of factors – but usually because the share appears to be very cheap in relation to its fundamentals. In other words, we expect it to be upwardly re-rated as its fundamental value becomes recognised by the institutional fund managers. A

JSE All Time Record High

On Friday last week, the 12th of July 2024, the JSE Overall index closed at 81686 – an all-time record high. Consider the chart:

The chart shows that the Overall