Looking for Quality
15 November 2019 By PDSNETThe JSE Overall index (J203) shows an average of most of the shares listed on the stock exchange. It used to be dominated by commodity shares involved in extracting South Africa’s vast mineral wealth and exporting it overseas. Today, those massive mining companies have shrunk to a fraction of their former glory and instead the index is dominated by massive international companies like Naspers and Anheuser Busch. A large proportion of the JSE’s market capitalisation represents businesses which are not in South Africa and which offer local investors a hedge against the weakness of the rand.
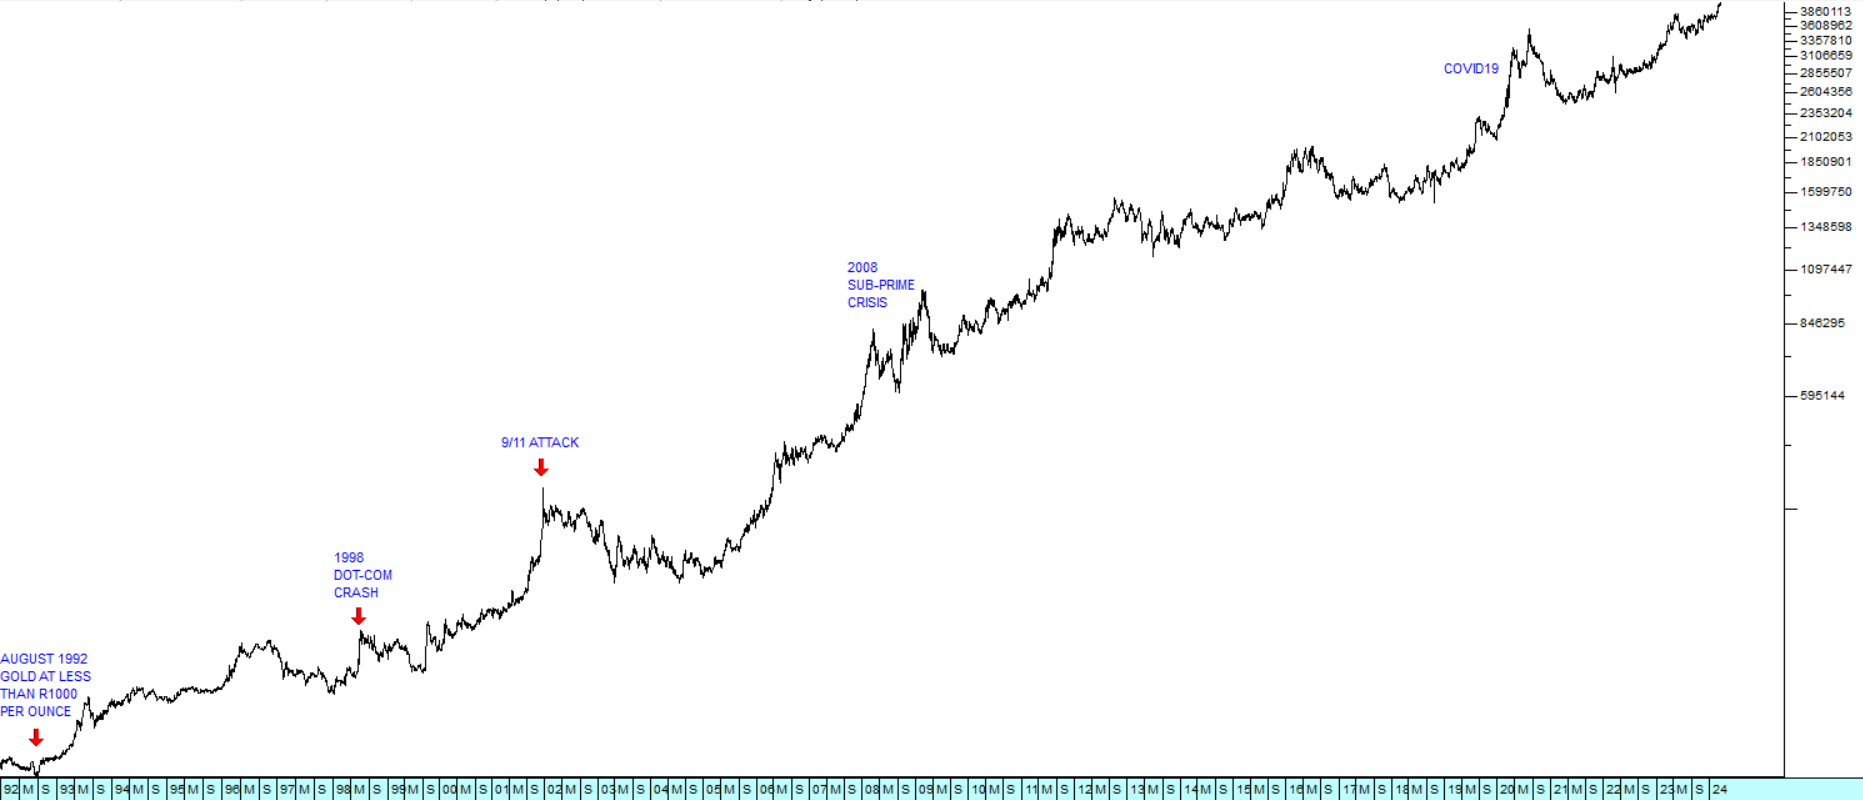
Over the past 34 years, the JSE Overall index has trended upwards, mainly because of the decline of the rand against hard currencies like the US dollar, the euro and the British pound. On average shares in the index have paid a dividend yield of approximately 3,5% per annum. Consider the semi-log chart:
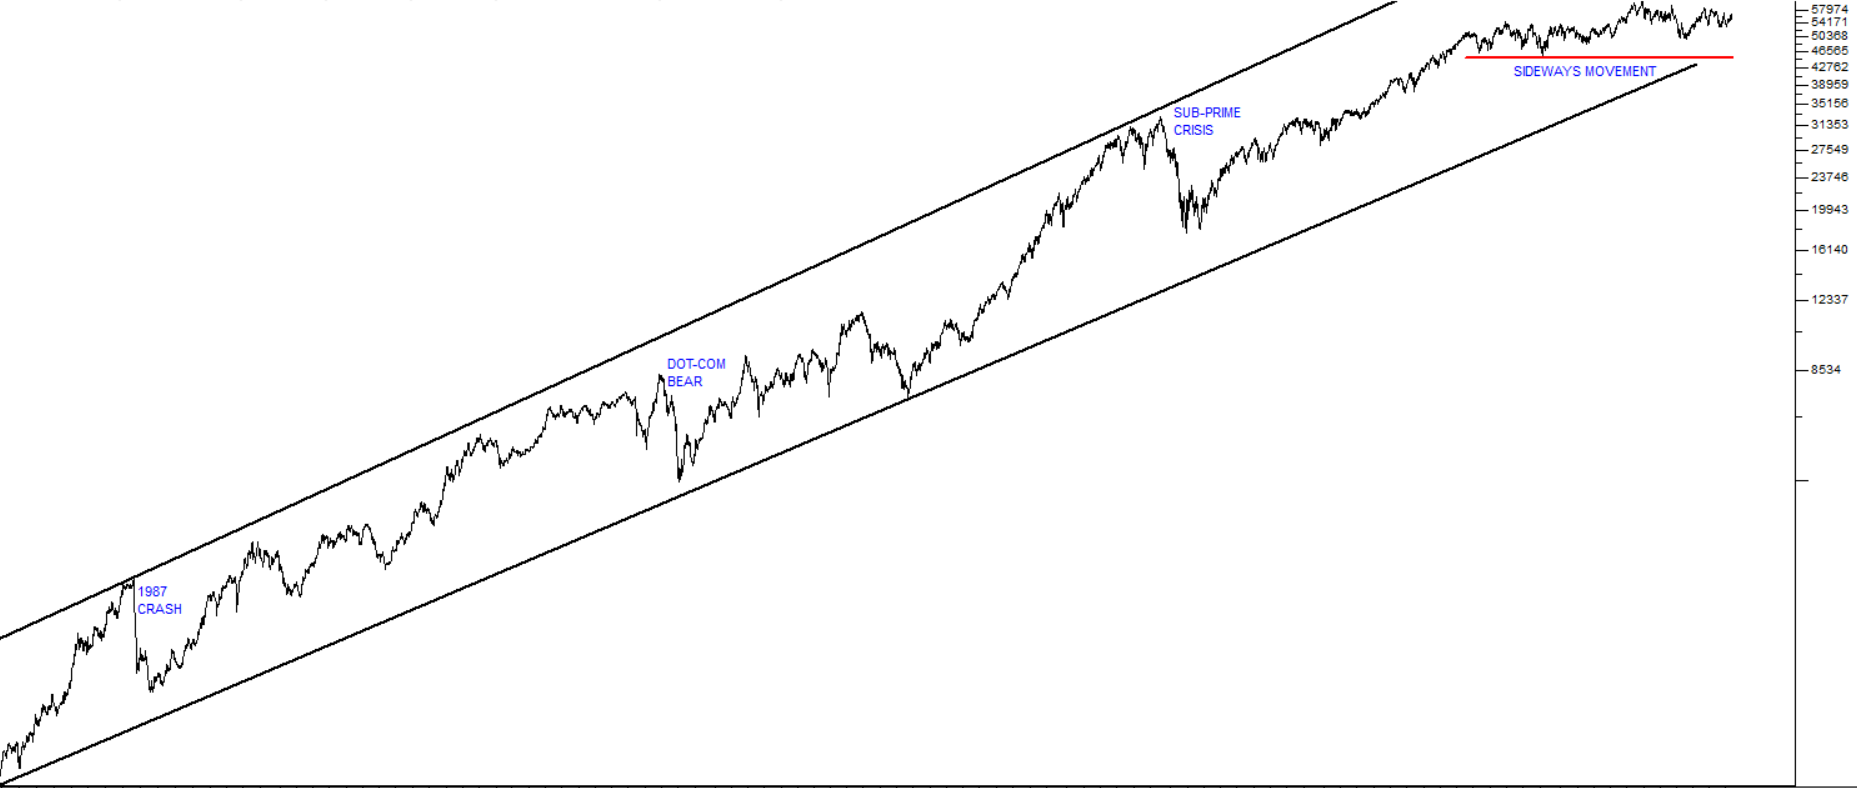
JSE Overall Index (J203) Semi-Log Chart 1985 to 2019 - Chart by ShareFriend Pro
This shows that the JSE Overall index has been moving up steadily over this very long time period despite the 1987 crash, the dot-com bear trend in 1998 and the sub-prime crisis of 2008. In the last five years (marked by the horizontal red line) the market has moved more or less sideways. This is almost entirely due to the impact of Zuma and state capture. However, in our experience, protracted sideways markets usually end with a strong upward move and we believe that this is exactly what the JSE will do. Right now, there are many solid blue chip shares listed on the JSE which are trading at relatively low prices. For the past five years they have been forced to conserve cash and operate very carefully because of relatively high uncertainty both locally and internationally. But this difficult situation affords private investors a useful opportunity to evaluate management performance. Any company that has survived through the Zuma years and especially the last five years is worthy of your consideration – especially if they have been able to re-position themselves for improved profits. The best of these will be those in the service industries where they have minimal exposure to working capital risk or union action (such as Capitec), but there are some in more difficult industries which have been shown to be exceptional performers. An example of this would be a share like The Foschini Group which is in a highly competitive consumer-facing industry where working capital is extremely difficult to manage. Their most recent results for the six months to 30th September show turnover up 6,5% and headline earnings per share up 3%. This clearly shows that the company is in survival mode. It is doing everything it can to make its operations more efficient, to keep costs under control and to steal market share from its many competitors. In the process it is showing its managerial superiority. It has successfully expanded overseas, including into the notoriously difficult Australian market where others like Woolworths have failed. It is implementing innovative digital solutions which enable it to manage its purchasing and stock levels optimally. It has significantly reduced the time that it takes for it to react to changes in fashion which means that its product range is more attractive to consumers. TFG’s CEO, Anthony Thunstrom, had this to say about these results:  “TFG’s performance for the 6 months to 30 September 2019 was achieved in a trading environment characterised by challenging conditions, increased pressure on consumers, retail industry disruption and low economic growth across all three of its major territories, South Africa, United Kingdom and Australia. Nevertheless, the Group outperformed the market in each of its three major territories and generated free cash flow in excess of R1,1 billion.â€Â This is the type of company that will be well placed to benefit from any recovery in the South African economy and which has shown its ability to cope with whatever difficulties may arise.DISCLAIMER
All information and data contained within the PDSnet Articles is for informational purposes only. PDSnet makes no representations as to the accuracy, completeness, suitability, or validity, of any information, and shall not be liable for any errors, omissions, or any losses, injuries, or damages arising from its display or use. Information in the PDSnet Articles are based on the author’s opinion and experience and should not be considered professional financial investment advice. The ideas and strategies should never be used without first assessing your own personal and financial situation, or without consulting a financial professional. Thoughts and opinions will also change from time to time as more information is accumulated. PDSnet reserves the right to delete any comment or opinion for any reason.
Share this article: