JSE Overall Index versus S&P 500 Index

11 July 2022 By PDSNET

The comparative relative strength index (CRSI) is a very useful indicator. It simply divides one data stream in your software by another and then draws a chart of the result. This enables you to compare the growth in the two data streams against each other graphically. 
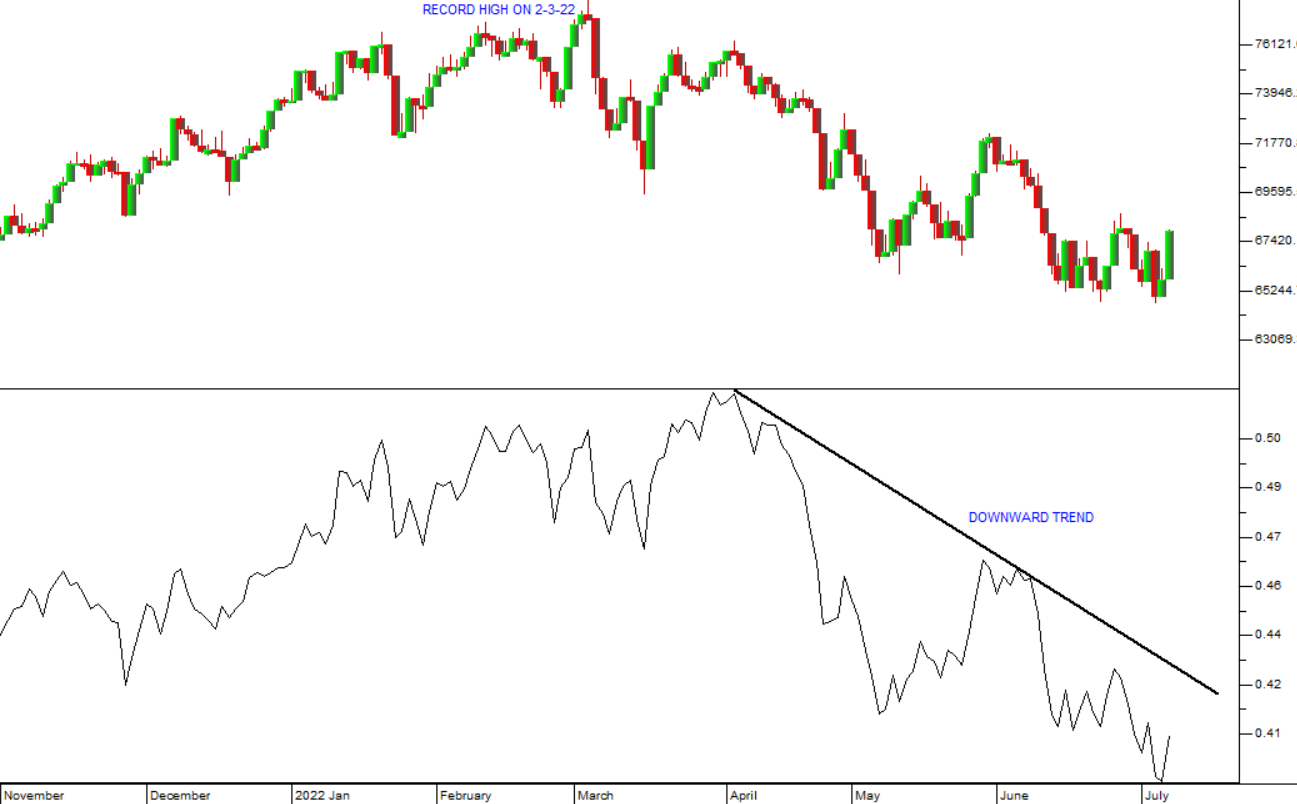
Consider the chart:


JSE Overall Index/S&P500 Index: CRSI: November 2021 - July 2022. Chart by ShareFriend Pro.


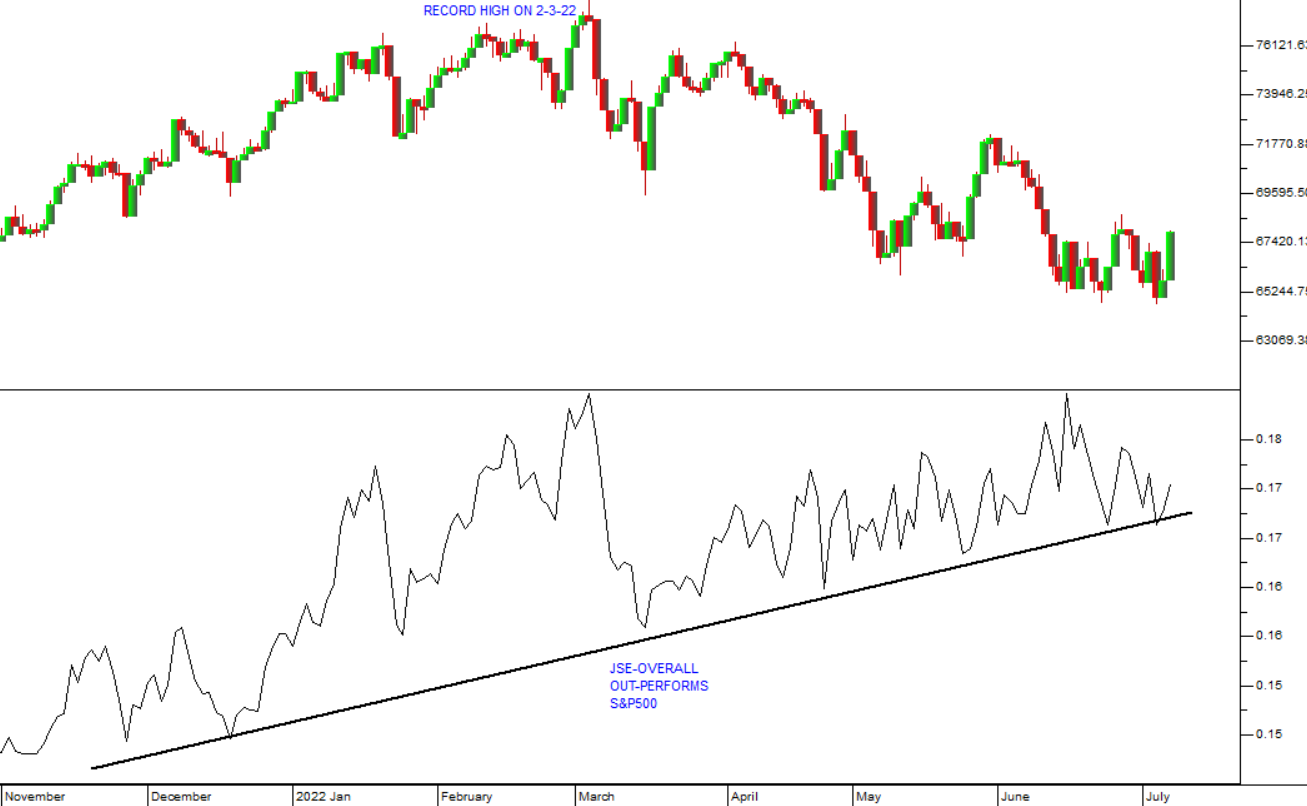
The top half of this chart is a candlestick of the JSE Overall index, showing its record high at 77536 on 2nd March 2022. The chart in the lower half of the screen is calculated by dividing the JSE Overall index by the S&P500 index from Wall Street. As you can see, the lower chart shows that the JSE Overall index has been outperforming the S&P500 index since December last year.

South African investors have been drawn to the fact that the downward trend on the JSE Overall index began three months later than the downtrend on the S&P500 and the fact that the JSE Overall index has only fallen by 16,16% so far compared to the S&P500 index from Wall Street which has fallen by as much as 23,55%. In fact, strictly, based on this, the JSE has not yet entered a bear trend – which is defined as a fall of at least 20%.

What this analysis leaves out is the rand/dollar exchange rate. If you again use the CRSI to divide the JSE Overall index by the rand dollar exchange rate, you will see that, in US dollars, the JSE Overall index has actually fallen by about 22%. Consider the chart:


JSE Overall Index/US dollar: CRSI: November 2021 - July 2022. Chart by ShareFriend Pro.


Here you can see that, in US dollars, the JSE Overall index peaked on 4th April 2022 and had fallen by 25% by 6th July 2022 – taking it comfortably into bear market territory. And this is because during that time the rand fell from R14.58 to R16.82 to the US dollar.

This analysis shows the usefulness of the CRSI indicator in your software. You can find the CRSI among the indicators listed at the bottom of your screen below the chart. To get a better explanation of the CRSI go to our lecture module 26.


DISCLAIMER

All information and data contained within the PDSnet Articles is for informational purposes only. PDSnet makes no representations as to the accuracy, completeness, suitability, or validity, of any information, and shall not be liable for any errors, omissions, or any losses, injuries, or damages arising from its display or use. Information in the PDSnet Articles are based on the author’s opinion and experience and should not be considered professional financial investment advice. The ideas and strategies should never be used without first assessing your own personal and financial situation, or without consulting a financial professional. Thoughts and opinions will also change from time to time as more information is accumulated. PDSnet reserves the right to delete any comment or opinion for any reason.


Share this article:

PDSNET ARTICLES

WeBuyCars

In a few days’ time, Transaction Capital (TCP) will unbundle and separately list its second-hand car sales company, WeBuyCars (WBC). The main benefit of this is to release the value of WBC into the hands of its shareholders. When the listing is complete, on 11th April 2024, WBC will have a total of 417,2m shares in issue which are expected to

Gold and Harmony

In our last Confidential Report, published on 6th March 2024, we drew your attention to the fact that the US dollar price of gold was about to break up through a critical resistance level at $2060. Gold has now moved up to $2166 so this observation provided an opportunity for private investors to make a significant capital gain, either in actual gold

Reverse Takeover

At the end of October 2023, Mix Telematics (MIX) was a relatively small fleet management company with a market capitalisation of just R2,3bn listed on both the JSE and the American NASDAQ. Its shares on the JSE were wallowing at a low of 380c. This compares with its competitor, Karoo (KRO), also listed on the JSE, but which was at the time, more

Rare Opportunity

You may not have been aware of it, but last week, between Monday and Friday, there was an opportunity to make an 80% profit on your capital. This opportunity occurred because of insider trading on a little known and traded share called Quantum Foods (QFH) in the poultry and animal feeds business.

Generally, the poultry business is

Excessive Bullishness

On Friday last week, the S&P500 index posted yet another new record closing high, but this time just one point higher than the previous day at 5088. This means that the index, which measures the progress of the 500 largest companies on Wall Street, has been climbing without a significant correction for nearly four months. Consider the chart:

Lessons from Transcap

As a private investor it is very important that you study what has happened in the past and learn from it. The progress of Transaction Capital (TCP) has provided us with an excellent opportunity to examine and learn from a complete cycle in an institutional favourite share. We can examine the entire cycle and see how to profit from it. In this regard, it is important

Sasol

Sasol is a company originally established in September 1950 by the National Party, to counter the possibility of petrochemical sanctions against the old South Africa. Essentially, Sasol used South Africa’s enormous coal reserves to generate about one third of its fuel requirements. Subsequently, Sasol became involved in the chemical industry which now accounts for about

4Sight

The world has, in the last twenty years, entered what has been characterised as the 4th Industrial Revolution (4IR). It has been described as “... the biggest structural change of the past 250 years — a transformation of scale, scope and complexity unlike anything humankind has experienced before.” In simpler terms, 4IR refers to the digital convergence of

The Great Bull Resumes

On the 12th of June 2023, we published an article, headed "Bull Trend?". In that article we suggested that, after a 25% correction, the great bull market on the S&P500 which began in March 2009 was still intact and would, in time break to a new all-time record high, above the high