Market View
J200 102,752.00 -0.85% J203 110,616.00 -0.82% J210 111,889.00 -1.45% J211 126,192.00 -1.28% J212 25,914.00 +0.27% J213 140,791.00 -0.52%
Winning Shares (Top 5)
Code Name Added Price Latest % Gain % Gain/Year
SDL SOUTH-PD 2025-09-09 725 1844 +154.34% +129.81%
SEA SPEARRIT 2024-06-26 888 1349 +51.91% +21.68%
RMH RMBH 2026-04-30 49 58 +18.37% +33.35%
OUT OUTSURE 2024-06-15 4457 9306 +108.80% +44.87%
ATT ATTACQ 2024-01-25 965 1796 +86.11% +30.61%
Opinions (Top 5)
Code Name Date Action
TKG TELKOM 2026-11-18 View

18-11-2026   Historically, Telkom (TKG) was the government-controlled provider of fixed line telephone connectivity in South Africa. With the advent of cell phones, Telkom was forced to subsidise the development of its own competition in the form of Vodacom, MTN and more recently Cell-C.

This subsidy takes the form of termination rates for calls which are now being phased out. Over the past twenty years, the CEO of Telkom, Sipho Maseko, says that Telkom has effectively subsidised other networks to the tune of R70bn. Telkom is currently listed and is owned 41% by the government and 11,9% by the Government Employees Pension Fund (GEPF) - so it could still be considered to be government-controlled.

In reality, it operates as an independent organisation divided into 4 divisions. (1) Open Serve is South Africa's primary supplier of wholesale connectivity with the country's largest network. (2) Telkom Consumer is the largest supplier of broad-band internet connectivity with a growing mobile phone network.

(3) Yellow Pages provides advertising and marketing to local businesses. (4) BCX is an ICT solutions company operating in Southern Africa. In its results for the six months to 30th September 2026 the company reported revenue up 2% and headline earnings per share (HEPS) up 9,3%. The company said, "Robust cash generation, with free cash flow (FCF)(2),(3) increasing by 37.8% to R998 million, driven by improved operational performance and disciplined capital allocation". Technically, Telkom's share fell from highs of around R98 in June 2019 to levels around R15.00 in March 2020.

It has now entered a new upward trend and it was added to the Winning Shares List (WSL) on 16th November 2024 at 2884c. It has since risen to 5439c (4-8-26). The latest results and the special dividend from the sale of Swiftnet boosted the share's price. In our view, this company has been battling to find a new direction in a recovering economy and against stiff competition, but the latest results are positive.

On 16th November 2026 MTN announced that it had re-commenced negotiations to acquire Telkom resulting in a jump in Telkom's share price.

GRSP GOLDRUSH 2026-11-18 View

18-11-2026 Previously, RECM Calibre, Goldrush is a company engaged in Bingo, Limited Payout Machines, and Retail Sports Betting. In its results for the six months to 30th September 2026 the company reported gaming revenue up 2% and headline earnings per share (HEPS) of 35,97c compared with 7,13c in the previous period.

The company said, "The Lottery division posted revenue of R2.2bn, delivering an operating profit of R37m. Group operating profit rose by 42% to R144m. The 108% growth in Profit After Tax to R44m is in no small way thanks to the addition of the lottery operations" Goldrush owns 50% of Sizekhaya which has been awarded the lucrative R90bn contract to run the national lottery.

Business Day reported on 24th June 2025  that the awarding of this contract may be controversial as members of the National Lottery Commission (NLC) have links to the adjudication committee which decided the winner indicating a conflict of intereSt. Since the listing of Goldrush, the volume traded has dropped off substantially to an average of R21 000 per day on average which makes it impractical for private investors.

The share price has also fallen back to 620c (17-11-26) which indicates that there is considerable selling. It is early days, but we believe that this share may be dangerous for private investors.

TMT TREMATON 2026-11-18 View

Trematon (TMT) is an investment holding company with subsidiaries, joint ventures and associate companies, mostly in the Western Cape. The company also invests in listed and unlisted shares. Originally most investments were related to property, but its investments have moved outside that.

The company owns Club Mykonos. In its results for the six months to 28th February 2026 the company reported revenue down 63% and headline loss of 0,08c per share compared with a profit of 0,03c in the previous period. The company's net asset value (NAV) decreased 56% to 127c per share.

The company said, "...the board’s strategy to dispose of all of Trematon’s investments, the disposals of CML and GenEd now being agreed. The effect of this on the condensed consolidated interim results (“interim results”) is that these major investments are excluded from the statement of comprehensive income".

In a trading statement for the year to 31st August 2026 the company estimated that it would make a headline loss of between 7c and 8,6c compared with a restated loss of 8,4c in the previous period. The share has only about R8500 worth of shares changing hands each day - so it is impractical for private investors. 

NCS NICTUS 2026-11-18 View

18-11-2026   Nictus (NCS) is a furniture and electrical appliance retailer with three stores in South Africa. It also sells short-term insurance through Corporate Guarantee. In its financials for the year to 31st March 2026 the company reported total assets up 31% to R1094,2m and headline earnings per share (HEPS) up 84,28%.

The company said, "For the year under review, the group’s profit before taxation amounted to R50,3 million compared to a profit of R28,9 million in the previous year. The company’s profit before taxation for the year was R4,6 million compared to a profit of R2,6 million in the previous year".

In a trading statement for the six months to 30th September 2026 the company estimated that HEPS would fall by between 14% and 34%. The enduring problem with this company is that its shares are far too thinly traded to be practical for private investors.

CML CORONAT 2026-11-18 View

18-11-2026 Coronation (CML) is one of South Africa's largest asset managers and the only one listed on the JSE. Founded in 1993, the company grew very well until 2015. At that point, the founding CEO resigned and a new CEO, Adrian Pillay, took over. Pillay is eminently well-qualified for the job, but things have not done well since he took over.

The company was heavily invested in African Bank and lost a lot of money there. It was also heavily invested in Steinhoff. These missteps have caused the investment community to re-evaluate Coronation's ability to keep choosing winners on the JSE and elsewhere. The result has been an outflow of institutional funds.

The fund management business is all about confidence. As a fund manager you need to get institutional fund managers to trust your judgement. Usually that means employing a team of very highly qualified people with solid track-records in managing funds. Unfortunately, no matter how good your team is, they are going to make mistakes and lose money sooner or later.

On 13th October 2024 the company said it intended to increase black ownership from the current level of 31% to 51% to enable it to obtain more business from government agencies like the Government Employees Pension Fund (GEPF). On 22nd April 2025 the company announced that AUM on 31st March 2025 was R676bn.

In its results for the year to 30th September 2026 the company reported revenue unchanged and headline earnings per share (HEPS) down 14%. Assets under management (AUM) reached R750bn. The company said, "As of 30 September 2026, 92% of our portfolios had outperformed their benchmarks since inception, 91% over 20 years and 78% over 10 years".

Technically, the share has been in a downward trend since January 2026. We believe that it offers good value at current levels (3936c on 17-11-26).

Winning Share: RMH
Opinion: TMT
Nvidia  (2026-11-16)

Charismatic leadership in business can often be a major problem. When a company is dominated by a single individual who then becomes incapacitated for some reason, the result is normally a sharp downward re-rating of the share. Charismatic leadership can increases the key-person risk for an…

Charismatic leadership in business can often be a major problem. When a company is dominated by a single individual who then becomes incapacitated for some reason, the result is normally a sharp downward re-rating of the share. Charismatic leadership can increases the key-person risk for an investor.

In the current case of Nvidia, the CEO, Jensen Huang, has now resigned following a series of scandals regarding his extra-marital affairs and their possible link to Chinese spying. The impact on the share price over the past month has been substantial. On 6th October 2026 Nvidia shares closed at $241,90 and on Friday last week they closed at $162,83 – that is a drop of almost one third and wiped $1,85 trillion off its market capitalisation. Consider the chart:
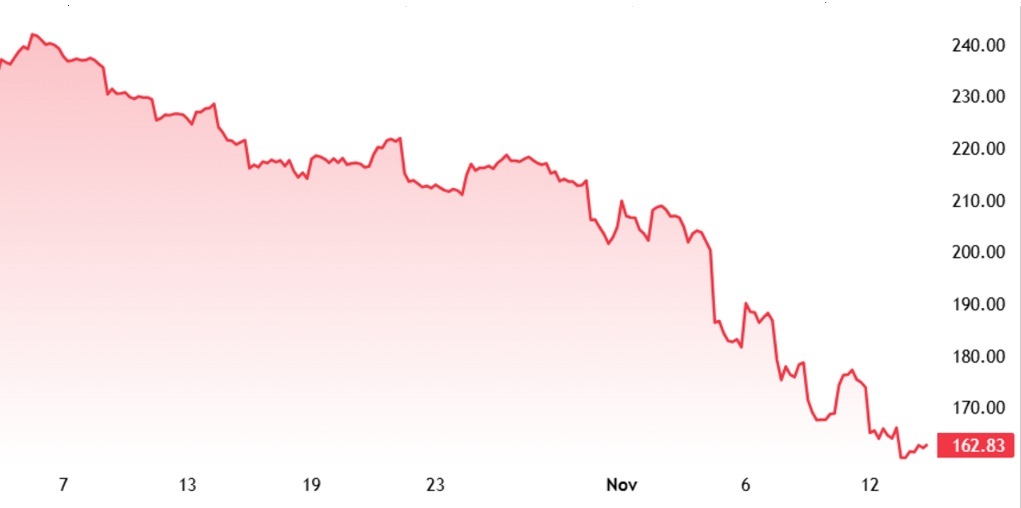
Nvidia : 7th of November 2026 - 13th of November 2026. Source: https://www.tradingview.com/symbols/NASDAQ-NVDA/?timeframe=3M


Huang was the co-founder of Nvidia in 1993 and had served as its President for 33 years. After early struggles, the company broke through with chips like the RIVA 128 and went public in 1999, the same year it introduced the GeForce 256—the world's first graphics processing unit (GPU). This led to the bold bet to launch CUDA, a parallel computing platform that allowed GPUs to handle general-purpose computing—laying the foundational software architecture for modern deep learning and artificial intelligence (AI). This scaled Nvidia into the backbone of the global AI and data centre revolution, driving the company to a multi-trillion-dollar valuation and transforming it into one of the most influential technology companies in history.

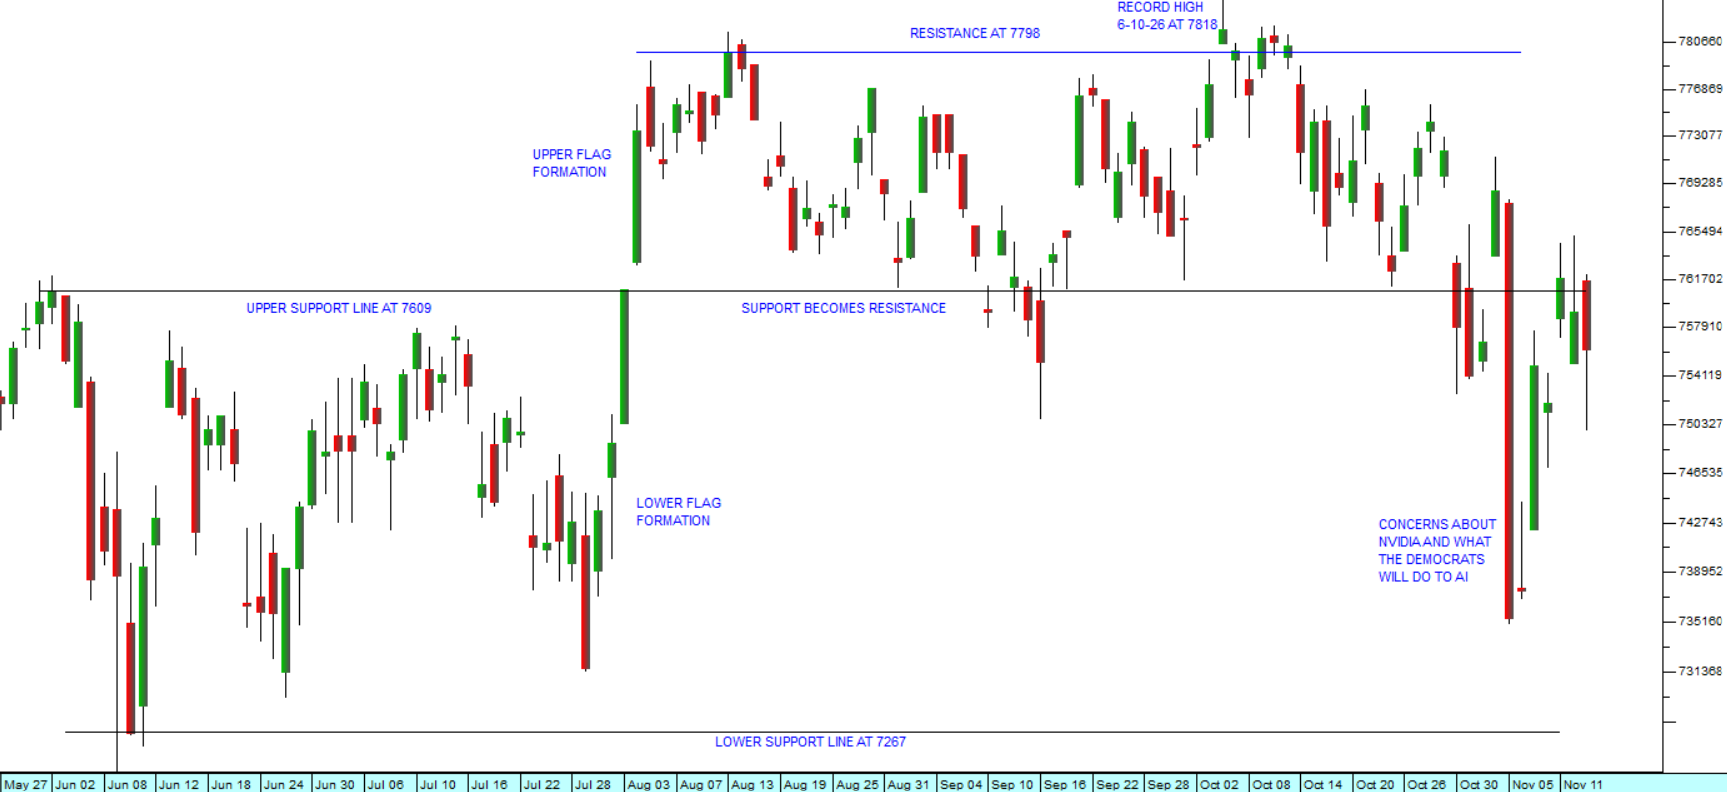
Clearly, Huang was an important person and his leadership on the Nvidia board was crucial – so when rumours began circulating of his relationship problems and the possible connection to China, investors began selling the stock as concerns about leadership uncertainty increased. What is interesting is that the sharp decline in the price of Nvidia has not dragged the other shares in the Magnificent 7 down with it, and while it was the main contributor to a correction in the S&P500, it has not precipitated a major collapse. The S&P500 also reached an all-time record high on 6th October 2026 closing at 7818, but it was only down by 3,3% from that record high at Friday’s close. Consider the chart:

S&P500 Index :  27th of May 2026 - 13th Of November 2026. Chart by ShareFriend Pro.

The chart shows that developments at Nvidia combined with concerns around what the Democrats might do to curtail the growth of AI took the S&P500 down but did not penetrate the lower support line at 7267. In our view, AI has its own momentum and is now stimulating growth in most companies across America and the world. The Democrat victory in the mid-term elections is unlikely to derail that. One major positive impact of the election was that it immediately brought the price of North Sea Brent down to $95.

In our view, the Democrat win also brings another major positive – it signals the end of the MAGA/Trump era with all the uncertainty that that entailed. Notably the JSE Overall index has actually been going up since 6th October 2026 showing that local investors never really believed that Wall Street was in a major correction. We are expecting further declines in the price of oil and fewer disruptive shocks from the Trump administration going forward.  
Democrat Sweep  (2026-11-09)

It seems fair to say that while most analysts and investors expected the Democrats to do well in the US mid-term elections, most were also caught completely off-guard by the extraordinary extent and depth of that win - and this has resulted in a burst of increased volatility in the markets as they…

It seems fair to say that while most analysts and investors expected the Democrats to do well in the US mid-term elections, most were also caught completely off-guard by the extraordinary extent and depth of that win - and this has resulted in a burst of increased volatility in the markets as they adjust to the new reality. Trump’s decision to appoint Stephen Miller as his Chief of Staff shows that he has no intention of moderating his position by working with the Democrats – instead he is doubling down on the extreme right-wing politics which has made him so unpopular.

The initial reaction to the vote was undoubtedly one of relief and euphoria as the Democrats claimed first the House and then the Senate. Then the next day that excitement gave way to fear that they might use their now overwhelming power to somehow curtail or limit AI and the build out of data centres across America.

This led, the next day, to a massive 4,4% drop in the S&P500, completely wiping out the gains of the previous day and taking the NASDAQ particularly, down sharply. Voters and newly elected officials have already passed dozens of local measures restricting data centres (from outright bans to temporary moratoriums), while incoming governors in states like Texas and Georgia have signalled plans to pause or heavily regulate new construction.

Hyperscalers and data centre operators have been funding massive expansions with heavy borrowing and private credit. Rising AI credit costs and heavy debt loads have sparked fears among investors of financial strain, stranded assets, or potential defaults if demand falls short. What if the direction of the technology changes and these huge investments are suddenly irrelevant and there is an unsupportable overhang of debt and abandoned assets?

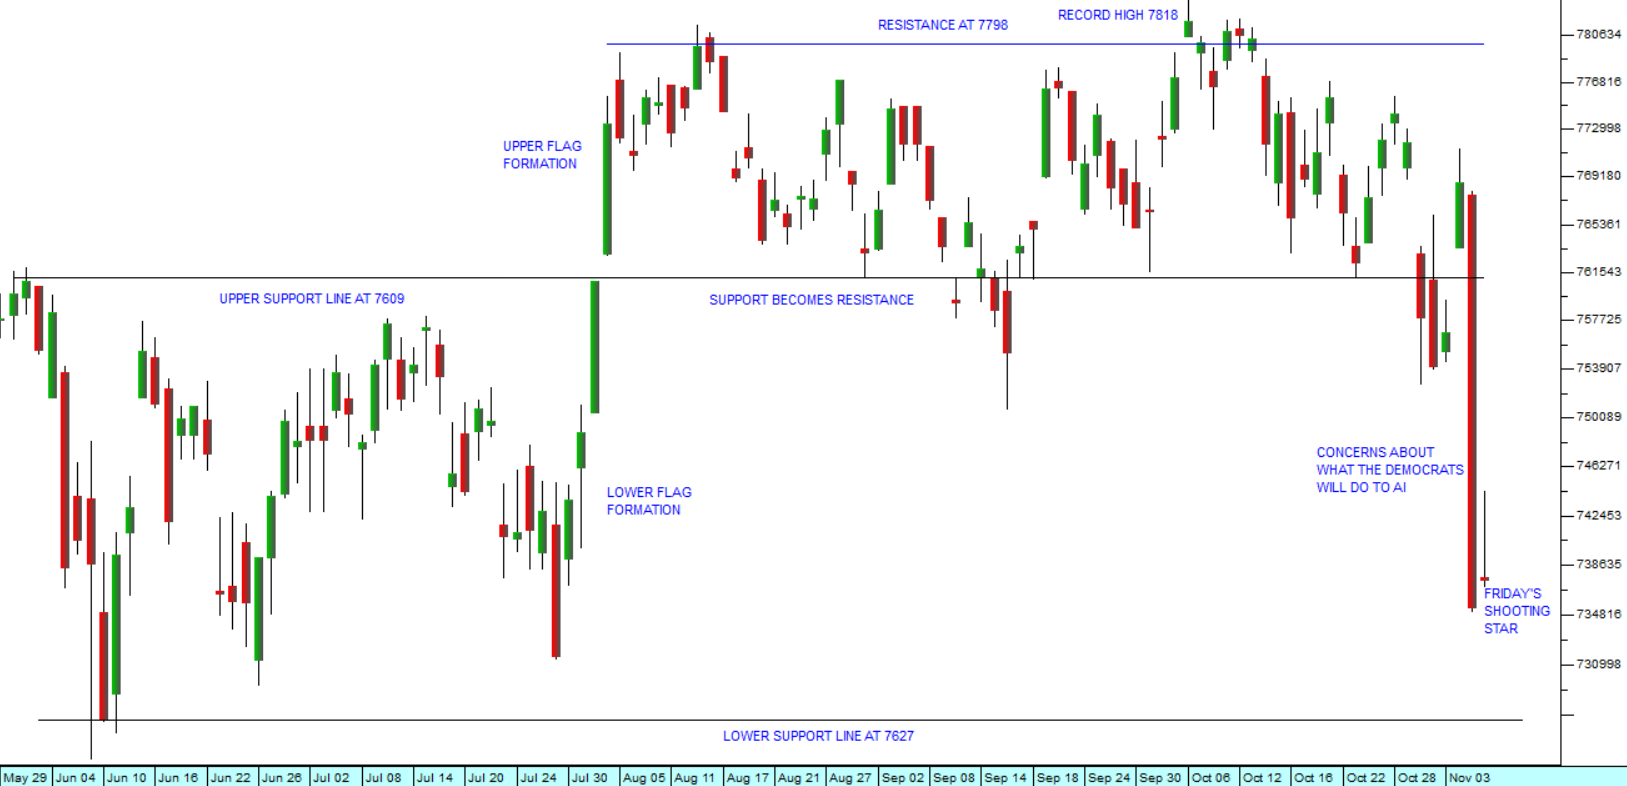
Those fears, added to the fact that tech shares were very already high and due for some kind of correction, has led to a rapid rotation out of AI and into other sectors or into cash. Consider the chart:

S&P500 Index : 29th of May 2026 - 6th of November 2026. Chart by ShareFriend Pro.

Of course, the Anthropic IPO is due to happen on 19th November 2026 and their prospectus has already been issued. They are looking to raise between $80bn and $100bn off a market valuation of between $1,5tr to $2tr. That will now almost certainly have to be curtailed – possibly to as little as $1tr. While Anthropic showed explosive growth - posting $16.3 billion in revenue for the first half of 2026 (up 1,300% year-over-year) - it also recorded an $80.7 billion net loss during that same period.

As a private investor on the JSE watching all this unfold on world markets and with our own election results in the background, you must obviously ask how these things will impact on emerging markets and on South Africa in particular. Our markets, and especially the rand have remained remarkably stable throughout the turbulence. The rand weakened, as far as R16,75 to the US$ and strengthened as far as R16,35, and now has settled in the middle ground of R16,51. This shows that the sharp downward move on Wall Street has not resulted in a huge shift towards risk-off among international investors. The smart money is still buying South African high-yield bonds and our relatively cheap high-quality equities.

On Friday, the US markets stabilised with many investors buying the dip and other even going as far as selling put options for a quick gain if the market recovers some of its former balance. However, the  shooting star formation does not bode well for the coming week. From a purely technical perspective, the lower support line on the S&P at 7626 now becomes important. If that is broken then we are in a full-blown correction.

Against this, we look at the underlying fundamentals of the third quarter S&P500 company earnings and feel that, at the very least, the Thursday sell-off was over-done. At this time 88,2% of S&P500 companies have reported and 82% of those have beaten earnings projections while 74,6% beat revenue expectations. This shows that the bull trend has been very well supported by rising profits across the board. In other words, it does not have the look of a bubble in the throes of bursting. But, in these turbulent times, your ultimate protection remains your stop-loss strategy.

Sasol and the Rising Oil Price  (2026-10-26)

Every major event that happens in the world inevitably offers some kind of investment opportunity for the private investor. The challenge is to work out how best to capitalise on it. So, it was with the war in Iran. At the time that the war began with the Israeli and American bombing raids on 28th…

Every major event that happens in the world inevitably offers some kind of investment opportunity for the private investor. The challenge is to work out how best to capitalise on it. So, it was with the war in Iran.

At the time that the war began with the Israeli and American bombing raids on 28th February 2026, we had already been watching the progress of Sasol for some time. The situation in Iran was tense with riots reported and North Sea Brent had climbed back up to $70 per barrel, but we had no idea that the Americans and Israelis were about to launch a bombing attack.

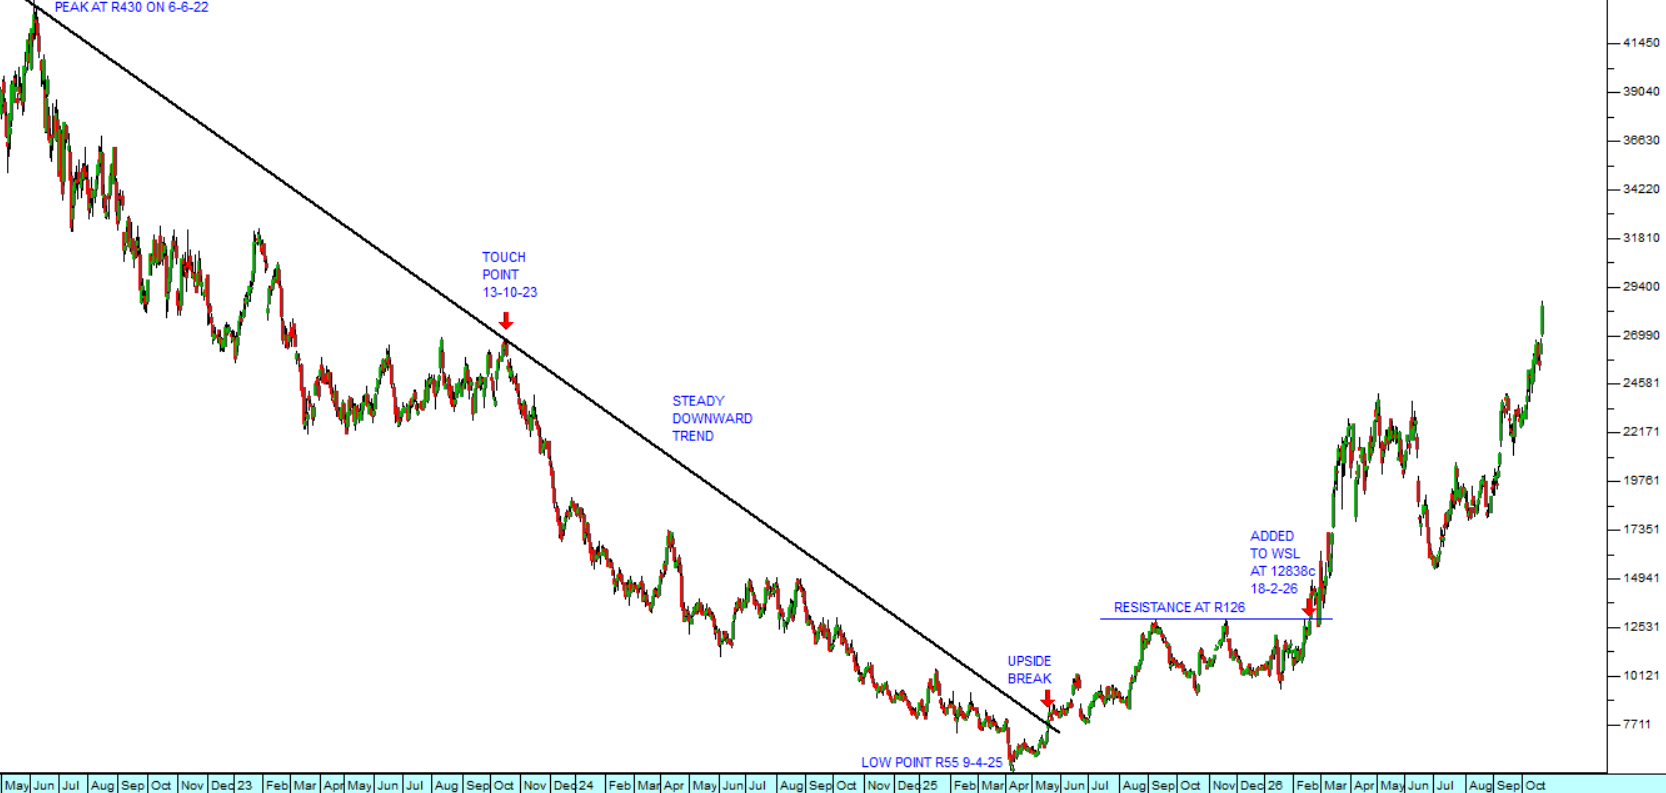
Sasol was always a blue-chip share and has historically occupied a dominant position in South Africa's synthetic fuels industry. It had, however been through some difficult times and the share price had fallen from a high of R430 per share to as low as R55 in April 2025. It then went through an extended period of sideways consolidation. We finally decided to add it to the Winning Shares List (WSL) on 18th February 2026 at a price of R128.36. Technically the share broke above resistance at R126 indicating that something was afoot. Consider the chart:

Sasol (SOL) : May 2022 - 23rd of October 2026. Chart by ShareFriend Pro.

The chart shows Sasol’s long downward trend that began in the middle of 2022, mainly because of the falling price of various grades of oil. North Sea Brent oil fell from a high of $125 per barrel on 8th March 2022 to its cycle low just below $60 per barrel in mid-December 2025. Since Sasol derives more than half of its revenues and profits from the fuel industry, it is directly linked to the price of oil.

Sasol had been recovering but had encountered significant resistance at R126 per share. When it broke decisively above that level, that gave us the signal we needed. Immediately prior to the start of the war the oil price had been climbing, and in January 2026 there were riots in Iran which Trump and Netanyahu used as a pretext to begin the bombing. The price of Brent rose above $70 per barrel on 18th February, before the bombing started, and that triggered a rise in Sasol’s share price. We decided then that Sasol was probably under-valued and due for an upside move.

Sasol’s latest results for the year to 30th June 2026 show the benefits of the rising price of oil. Turnover was up 9% and earnings before interest taxation depreciation and amortisation (EBITDA) was up 17% while the company reduced its debt by 11%.

We do not normally advise investors to buy commodity shares like Sasol because they are riskier, but sometimes they can offer very good capital gains. In the case of Sasol the share appreciated rapidly after we added it to the WSL and then there was a correction as the oil price temporarily fell back in June and July this year. We held on because we thought there might be further upside potential.

The best investment policy is to try to hold onto your shares for at least three years, unless you are moving into a loss position (i.e. you had to execute an early stop-loss sale). This is because if you hold them for less than 3 years the Receiver may seek to declare you to be a share dealer – and then any gain you make will be added to your taxable income and you will be taxed on it at your marginal rate. If you hold for longer than 3 years, then your appreciation is treated as a capital gain for tax purposes and taxed at 18%.

As it turns out holding on to Sasol was the right decision and the share has now appreciated by 134% in about 8 months since we added it to the WSL – which is just shy of 200% per annum.

JSE Top 40

102,752.00 (-0.85%)

All Share

110,616.00 (-0.82%)

Financial 15

25,914.00 (+0.27%)

J200
J203
J212
Top Gainers
# Code Name Close (c) % move
1 EPS EASTPLATS 332 +47.56%
2 MTU MANTENGU 9 +12.50%
3 CNP CANALPLUS 5499 +9.96%
Top Losers
# Code Name Close (c) % move
1 YRK YORK 200 -16.67%
2 ENX ENXGROUP 207 -11.91%
3 ISO ASPI 2496 -10.92%

Top Movers – Charts

Top Gainer: EPS
Top Loser: YRK