CHANNEL
9 May 2016 By PDSNETA technical analysis term which refers to a period during which a data stream oscillates between upper and lower parallel channel lines. You will often find when looking at charts that there are times when a share or index moves up and down between parallel channel lines. Channel lines are trendlines which contain the upper and lower limits of the share or index movements. Consider the chart:
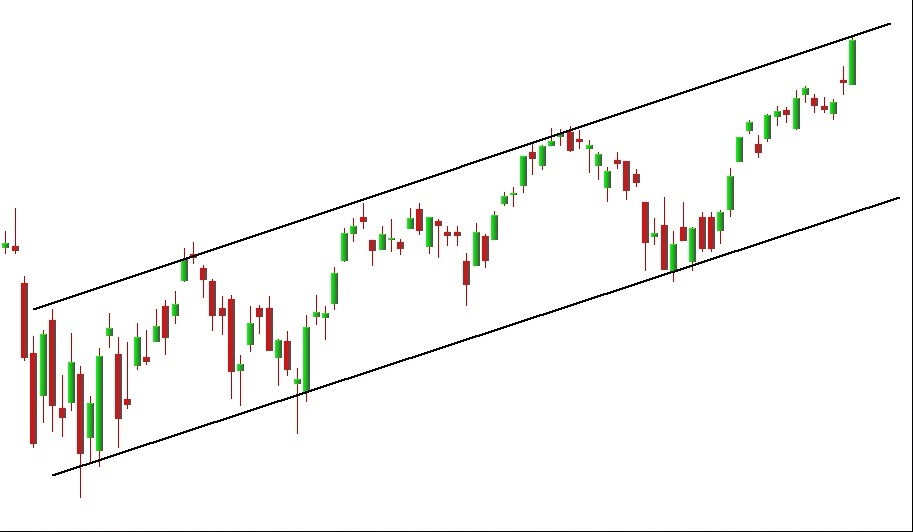
Here you can see that the S&P500 index oscillated between two parallel trendlines for a period of over 4 months during 2018 when it was recovering from a major correction. Notice that the trendlines are parallel - a clear indication of the efficacy of technical analysis. When the share or index breaks out of the channel, that is a signal that it will continue in the direction of the break. Channel lines are similar to support and resistance lines, except that they are either upward- or downward-sloping while support and resistance lines are horizontal.
Share this glossary term: