BHP Billiton - Oversold?
23 October 2019 By PDSNETIf you accept the fact that the world economy is in a growth phase, which is being led by strong growth in America, then it makes sense that commodity prices would be strong. And they have been, ever since the beginning of 2016. It also makes sense for private investors to look at commodity shares in light of this – especially the diversified, multi-national mining houses that operate all over the world. These enormous conglomerates are protected from the volatility of commodities by the fact that they operate in diverse geographies and mine a wide range of minerals. Perhaps the best example of such a share is BHP Billiton. This is the largest of all the mining houses and it has its headquarters in Melbourne in Australia. It processes a wide variety of minerals as well as oil and gas. It has 62000 employees, mostly in the Americas and Australia. It produces copper, iron, coal, oil, gas and a variety of other base and precious metals. Among its most valuable assets are:
- 57,5% of the Escondida mine in Chile which is one of the world’s largest copper producers and also produces some gold and silver.
- 33,75% of Antamina in Peru which produces copper and zinc.
- 100% of Pampa Norte which produces copper cathode in the Atacama Desert in Northern Chile.
- 50% of Samarco in Brazil which produces iron ore and a one third interest in Cerrejon in Colombia which produces coal from an open-cut coal mine.
- Mineral rights in Saskatchewan in Canada which contains one of the world's largest unexploited potash deposits.
- Olympic Dam in Australia which is one of the world's largest copper, uranium and gold ore bodies.
- Western Australia Iron Ore which is a system of five mines connected by more than 1000km of railway lines.
- Queensland Coal which comprises the Mitsubishi Alliance and Mitsui Coal.
- The Mt. Arthur open-pit coal mine in New South Wales.
- Nickel West which is a nickel mine with smelters, concentrators and a refinery.
- In the petroleum field it owns high quality resources in the Gulf of Mexico, Australia, Trinidad and Tobago.
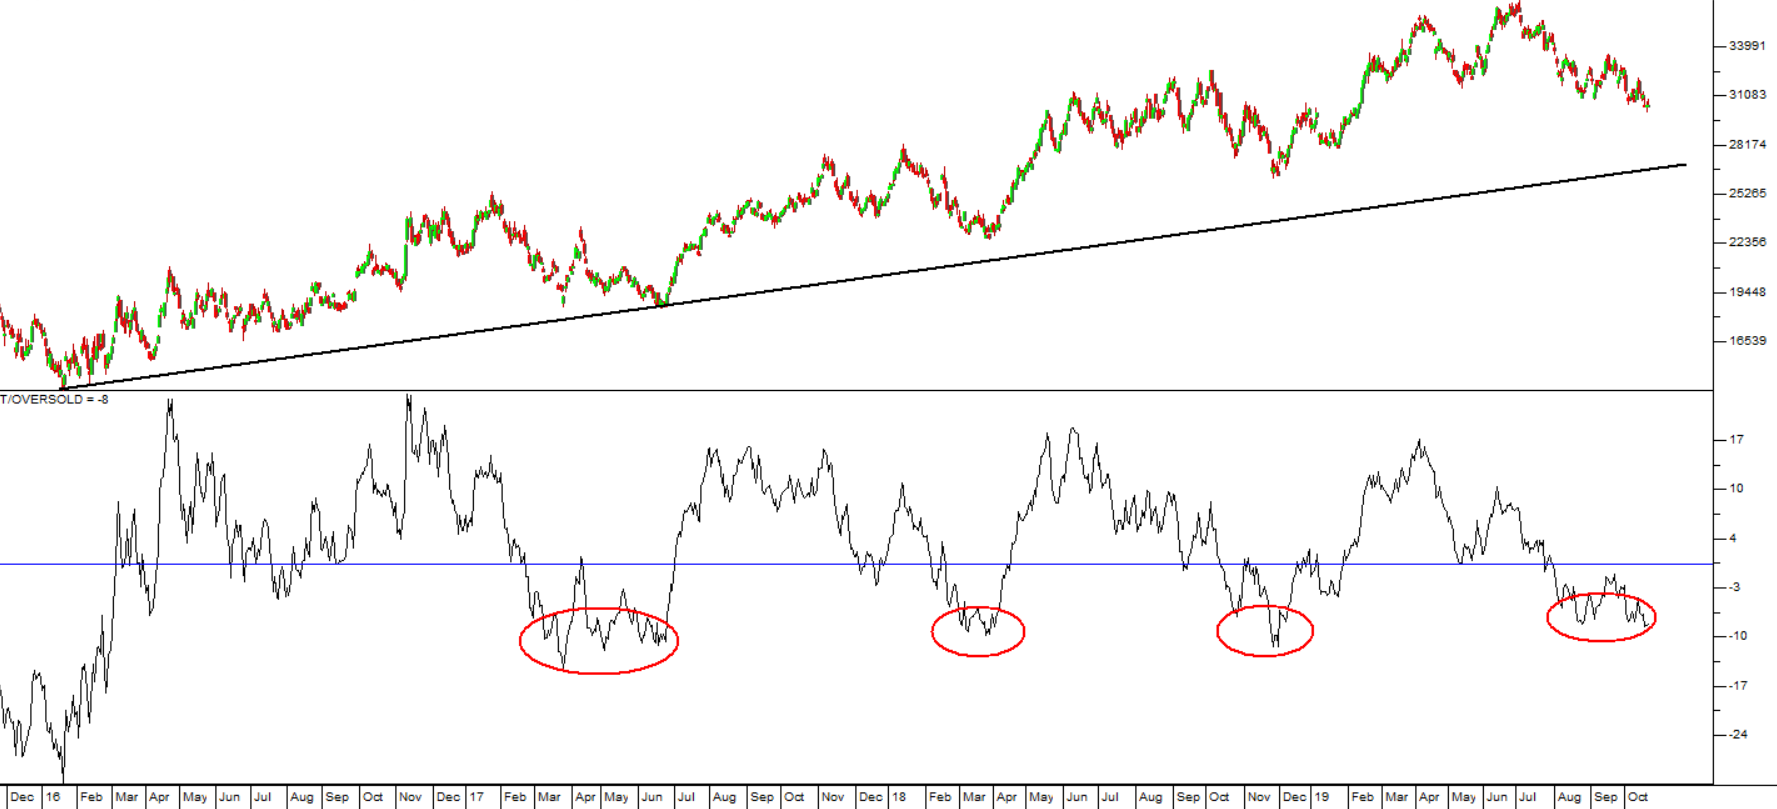
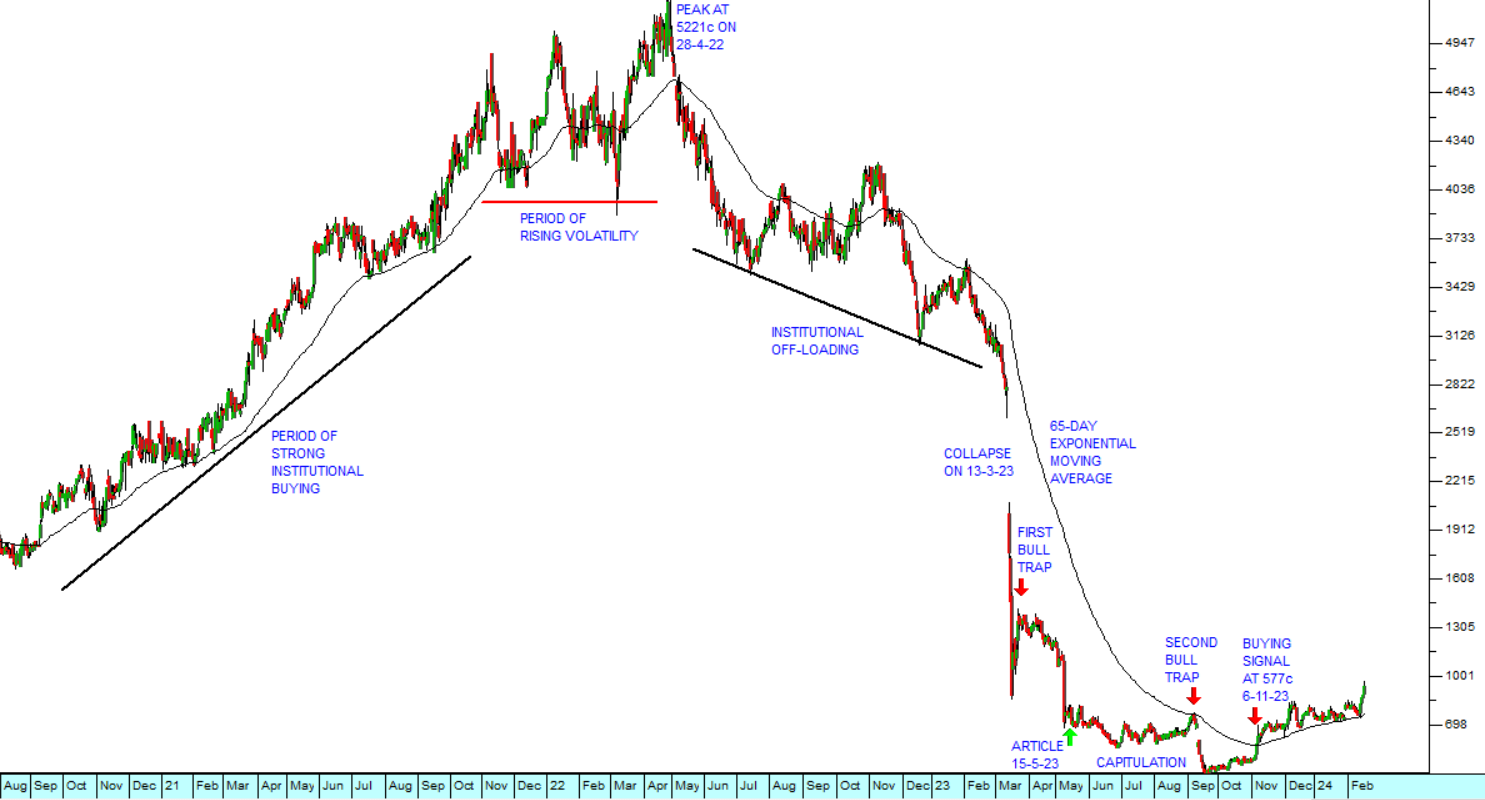
Above - BHP Billiton (BHP) December 2015 to October 2019 - Below - Overbought/Oversold Indicator - Chart by ShareFriend Pro
Here you can see that the top chart shows a simple candlestick chart of the share since the start of the commodity boom in 2016. That shows that BHP has been in a bull run since then, it's share price having gained 84% over this period. However, being a commodity share, the upward trend has been somewhat volatile. It has risen through a series of cycles which can be seen on the lower chart which is a 100-day overbought/oversold (OB/OS) (if you are not sure about how an OB/OS works go back and re-read module 26). What you will notice is that whenever the OB/OS falls below zero the share is oversold and represents a buying opportunity. Right now, it is in an oversold position of close to -10% and it looks cheap. Of course, because it is a commodity share it is imperative that you have a strict stop-loss strategy.DISCLAIMER
All information and data contained within the PDSnet Articles is for informational purposes only. PDSnet makes no representations as to the accuracy, completeness, suitability, or validity, of any information, and shall not be liable for any errors, omissions, or any losses, injuries, or damages arising from its display or use. Information in the PDSnet Articles are based on the author’s opinion and experience and should not be considered professional financial investment advice. The ideas and strategies should never be used without first assessing your own personal and financial situation, or without consulting a financial professional. Thoughts and opinions will also change from time to time as more information is accumulated. PDSnet reserves the right to delete any comment or opinion for any reason.
Share this article: