Since its inception in 1960 the JSE Overall index, including dividends, has generated an average compound growth rate of approximately 14,5% per annum in nominal terms. Of course, during that time there have been moments when the index was heavily over-priced – like in October 1987, immediately before the 1987 crash – and moments when it was heavily under-priced like March 1988 immediately after that crash.
Stock market averages or indexes, like the JSE Overall index, over time, always tend to equate to the real growth in the economy - plus the inflation rate. Sometimes investors get overly excited and bid shares up well above their real values and sometimes they become depressed and maudlin, causing shares to fall to record lows. But overall, in the long term, the JSE (and all stock markets around the world) will always go up because of the real growth in their economies and the steady erosion of the purchasing power of paper currencies that we call inflation.
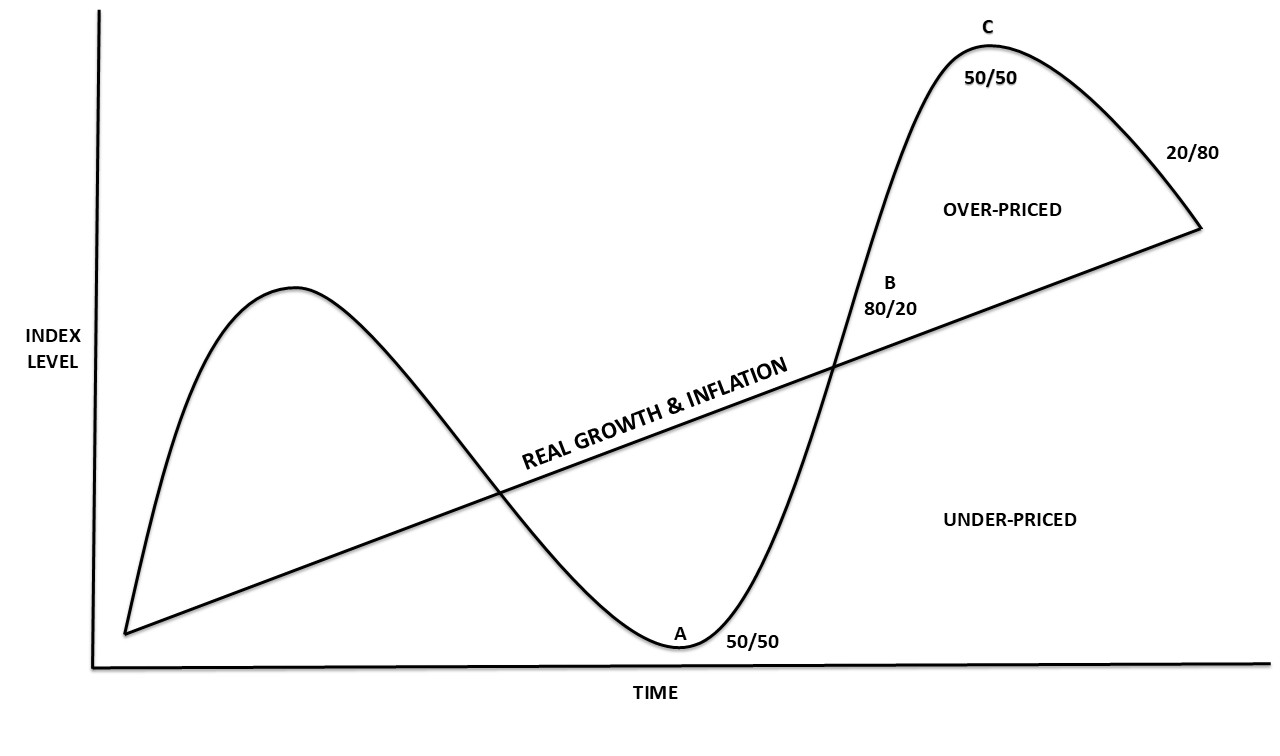
The progress of share market indexes over time could be represented diagrammatically as follows:
 Diagram : Market Cycle
The rising straight line represents the real growth of the economy plus the inflation rate, and the curved line shows the theoretical progress of the index through a full cycle. As you can see it fluctuates from being under-priced to being over-priced and back again.
At its lowest point (“A”), after a long downward trend, investor sentiment is balanced between the bulls and the bears (50/50). The negativity of the bears is now being balanced by the realisation that shares are very cheap, and bargain hunters are busy snapping up any loosely held scrip.
As the index begins to move up, sentiment shifts. More and more investors become bullish and there are fewer and fewer bears. Eventually, the index crosses that magical “real value” line (“B”) and the shares become over-priced – but it continues to go up. At this time, about 80% of investors are bullish and only 20% are bearish.
Eventually, some investors, (the smart money) begin to realise that shares are now over-priced, and they start off-loading their holdings. The point is reached where the bulls and bears are again in balance (“C”) with roughly half of them bullish and the other half bearish (50/50).
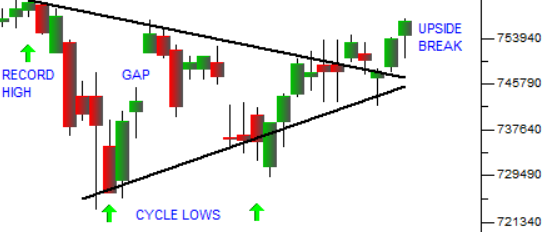
So, what is a sideways market? It is a period when investors as a group are more-or-less evenly divided between the bulls and the bears (i.e. 50/50). For a while neither can gain ascendancy and the index moves sideways. This typically happens at the top and the bottom of the cycle, but it can also happen during the upswing or downswing.
The S&P500 index, for example, right now has been moving sideways since about the end of May 2026 - a period of nearly two months. The shares of the Magnificent Seven have been moving sideways or downwards, but during that time the companies which make up the index have continued to grow and make profits – it is just that investors are worried about where they might go next.
The bears are out in force and there is the added uncertainty of where interest rates might go when the Monetary Policy Committee (MPC) meets again at the end of July. Tesla and Alphabet’s quarterly results were less than wonderful. Investors are suddenly worried about Alphabet’s expected $200bn full-year capex and Tesla’s disappointing profit. And now they are worried about Microsoft, Amazon and Meta which report next.
Actually, if you consider that Trump has resumed the Iran war and that the Houthis have closed the critical Strait of Bab-el-Mandeb pushing the price of North Sea Brent up to as high as $100, the S&P is doing relatively well. American analysts are calling the market “frothy” or talking about investors “walking on eggshells”.
This does not mean that the upward trend is over or that we are now looking at an impending bear market. It just means that the S&P is pausing to catch its breath after the rapid rise during April and May 2026. Markets never move in a straight line – there are always rallies and corrections and periods of indecision.
In our view, Trump is now facing a terrible dilemma. The November mid-term elections are just 3 months away and his approval rating is disastrous. His traditional MAGA supporters are abandoning him in droves because they really don’t like the high price of fuel. And his bombastic attitude towards the war, which everyone knows he started, is just making the situation far worse. We believe his time is rapidly running out. But we also believe that the AI productivity boom is just beginning and that markets will continue to rise to new record highs. Our view is that the longer this sideways market persists, the stronger will be the upward move when it is finally resolved.