Powells Punch
25 April 2022 By PDSNETIn November last year we wrote the following about the U.S. economy in the Confidential Report:
“…what if the Fed is wrong about inflation and it persists at the current high levels or even increases? September was the 5th month where inflation was above 5%. If they are wrong, then they will need to raise interest rates more rapidly. We think that this scenario…will result in a major correction fairly soon.”
That report was published on 3rd November 2021 when the S&P500 index had just made a new record high at 4660. In the same report we said of the predicted correction:
“…we believe that it will be a fall of between 460 points (10%) and 920 points (20%). A 20% fall will take the index back to its lower channel line at around 3680”.
Now that scenario which we warned of is coming to pass with a vengeance. US inflation in March 2022 hit an incredible 8,5% - a massive increase from the previous month’s 7,9% and way above the 5% levels seen immediately before September 2021.
This has now prompted the new Federal Reserve Bank (the Fed) chairman, Jerome Powell, to warn of a 50 basis point hike in interest rates at the May meeting of the US monetary policy committee (MPC). At the same time the Fed is reversing its policy of quantitative easing (Q/E) by reducing the size of its balance sheet at the rate of $95bn a month, known as quantitative tightening (Q/T).
This shift in monetary policy is very dramatic - and clearly overdue. As you would expect it is having a significant negative impact on share prices, especially tech shares, with the S&P falling by a total of 5% in the last two days of last week. The critical question now is:
Is this still just a correction or the beginning of a bear trend?
There can be little doubt that the Fed has foolishly allowed the inflation genie out of the bottle and it is going to require an extreme effort to put it back. But, at the same time, the US economy is booming with record low unemployment and massive profits being reported by listed companies.
For example, the Tesla results for the 1st quarter of 2022 beat analysts’ expectations by a massive 42,5% with earnings per share of 322c (US). The company made sales of $18,76bn in that single quarter.
At the same time the US economy created 431 000 new jobs in March 2022 and the unemployment rate fell to an amazing 3,6%.
We are almost certain that good news flowing through from the economy added to S&P500 companies’ quarterly results will soon displace the current negativity on interest rates and the S&P will resume its upward trend. In fact, we have predicted that the S&P could potentially reach a new record high by the end of June 2022.
From a technical perspective the correction in the S&P now looks like this:
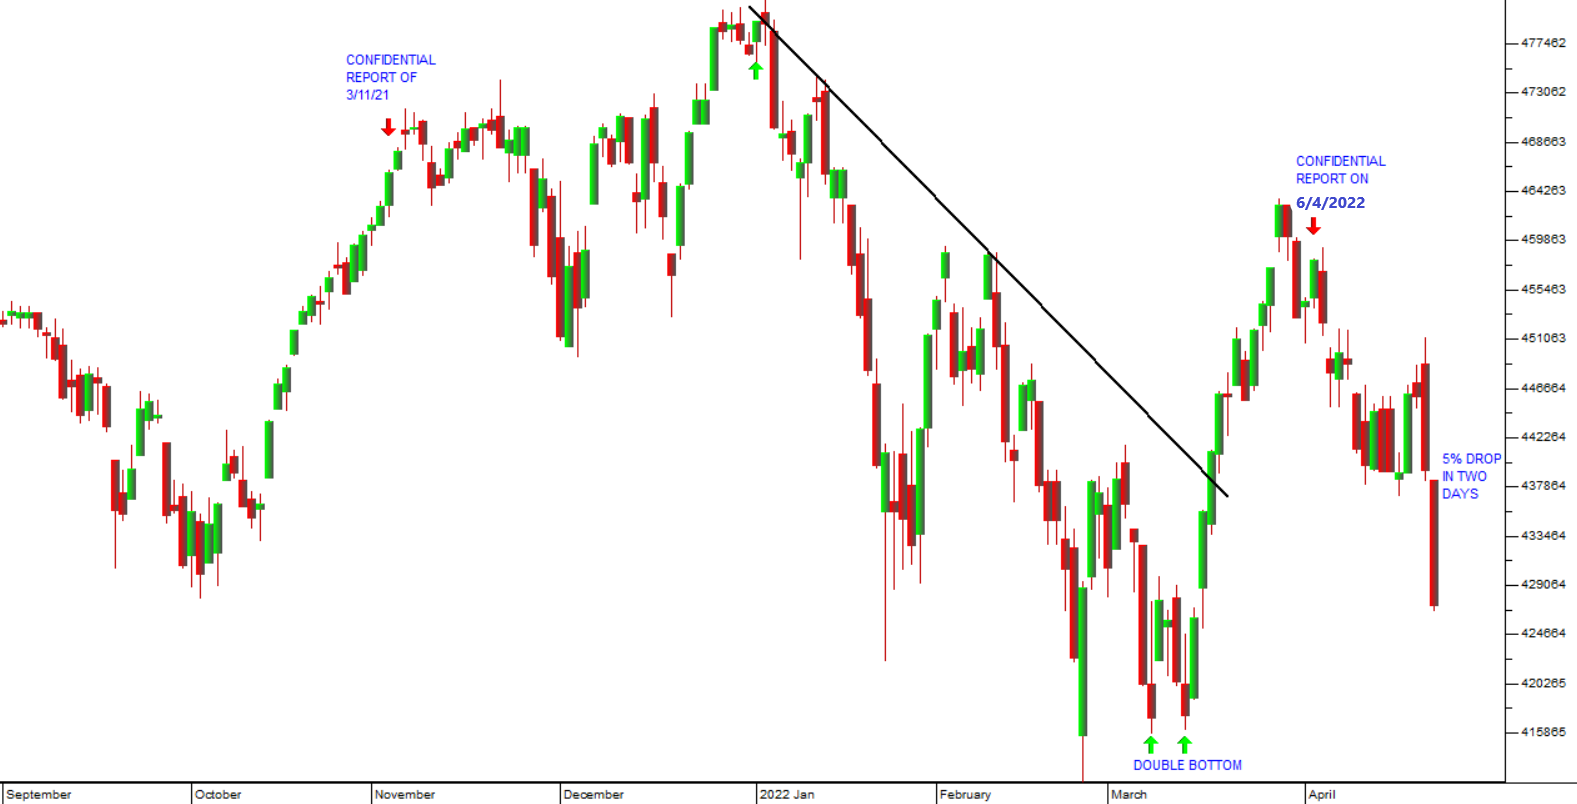
You can see that, until Powell’s shock announcement two trading days ago, the S&P was busy recovering from its “double bottom” low at 4170 on the 8th of March 2022 and 4173 made on the 14th March 2022.
With the unexpected downward move of the last two days, we must now consider whether the low of 4170 will be broken. We think not. In fact, we believe that markets have over-reacted to Powell’s words and will probably stage a recovery this week.
What is interesting though is how completely the markets’ attention has been diverted away from the war in Ukraine. In last month’s Confidential Report, published on the 6th of April 2022, we said the following:
“…the impact of the Ukraine invasion on world markets is fading fairly rapidly. The oil price is falling back, and financial markets are turning their attention elsewhere”.
While there remains the possibility that Putin will come up with some new and unexpected strategy, it seems more probable to us that both he and Russia are operating at the edge of what they are capable. They are now facing an experienced, well-armed and highly motivated force – while their demotivated army is being supported by an economy that is being systematically destroyed.
So, what this boils down to from a private investor’s perspective is that the correction remains a buying opportunity. Having said that, we should remind you to always maintain and stick to your stop-loss strategy.
DISCLAIMER
All information and data contained within the PDSnet Articles is for informational purposes only. PDSnet makes no representations as to the accuracy, completeness, suitability, or validity, of any information, and shall not be liable for any errors, omissions, or any losses, injuries, or damages arising from its display or use. Information in the PDSnet Articles are based on the author’s opinion and experience and should not be considered professional financial investment advice. The ideas and strategies should never be used without first assessing your own personal and financial situation, or without consulting a financial professional. Thoughts and opinions will also change from time to time as more information is accumulated. PDSnet reserves the right to delete any comment or opinion for any reason.
Share this article: