Lewis
19 April 2022 By PDSNETNineteen months ago on 2nd of September 2020 in the Confidential Report, we recommended buying Lewis shares when they were trading for just 1668c. The share has now moved up to 4670c – a gain of 180%. Amazingly, it remains excellent value today despite this substantial rise in its price.
The company has 817 stores with 84% of them in South Africa and the balance in the rest of Africa. It sells furniture, mostly to lower income groups, with about half of its sales being done on credit.
Obviously, a company like this is very dependent on working capital management. It has a substantial debtors’ book which has to be carefully controlled and then it has a significant amount of cash tied up in stock. Looking at its balance sheet of 30th September 2021, the company had about R4,5bn tied up in these two current assets – which was comfortably funded by current liabilities of R1,5bn and equity of about R4,7bn. What was notable is that the company had almost no debt and paid a paltry R20m in finance costs over the six months.
Its debtors’ book is a major source of income since it charges interest on the outstanding amounts. In the six months to 30th September 2021 this income amounted to R642,7m while the company’s debtor costs came to R273m, leaving the company with a significant profit of R369,7m.
In a trading update for the nine months to 31st December 2021, a period which includes the July 2021 civil unrest, the company reported merchandise sales up by 12,7%. The December quarter was particularly strong, “...supported by robust Black Friday trading". Sales were 20,7% above those of the pre-COVID-19 December quarter of 2019.
So all-in all, this is a powerful retailer with a massive store base that is growing despite all the difficulties of doing business in South Africa – and which has a debt-free balance sheet. What is extraordinary is that the shares are trading on a price:earnings ratio (P:E) of just 6,58 against the JSE’s average P:E of just under 12. And it has a dividend yield (DY) of 6,68% while the JSE’s average DY is 3,51%.
In addition, the company bought back 5,4m of its own shares in the six months to 30th September 2021 for an average price of 3594c per share – putting a further R194,5m into the hands of shareholders.
Consider the chart:
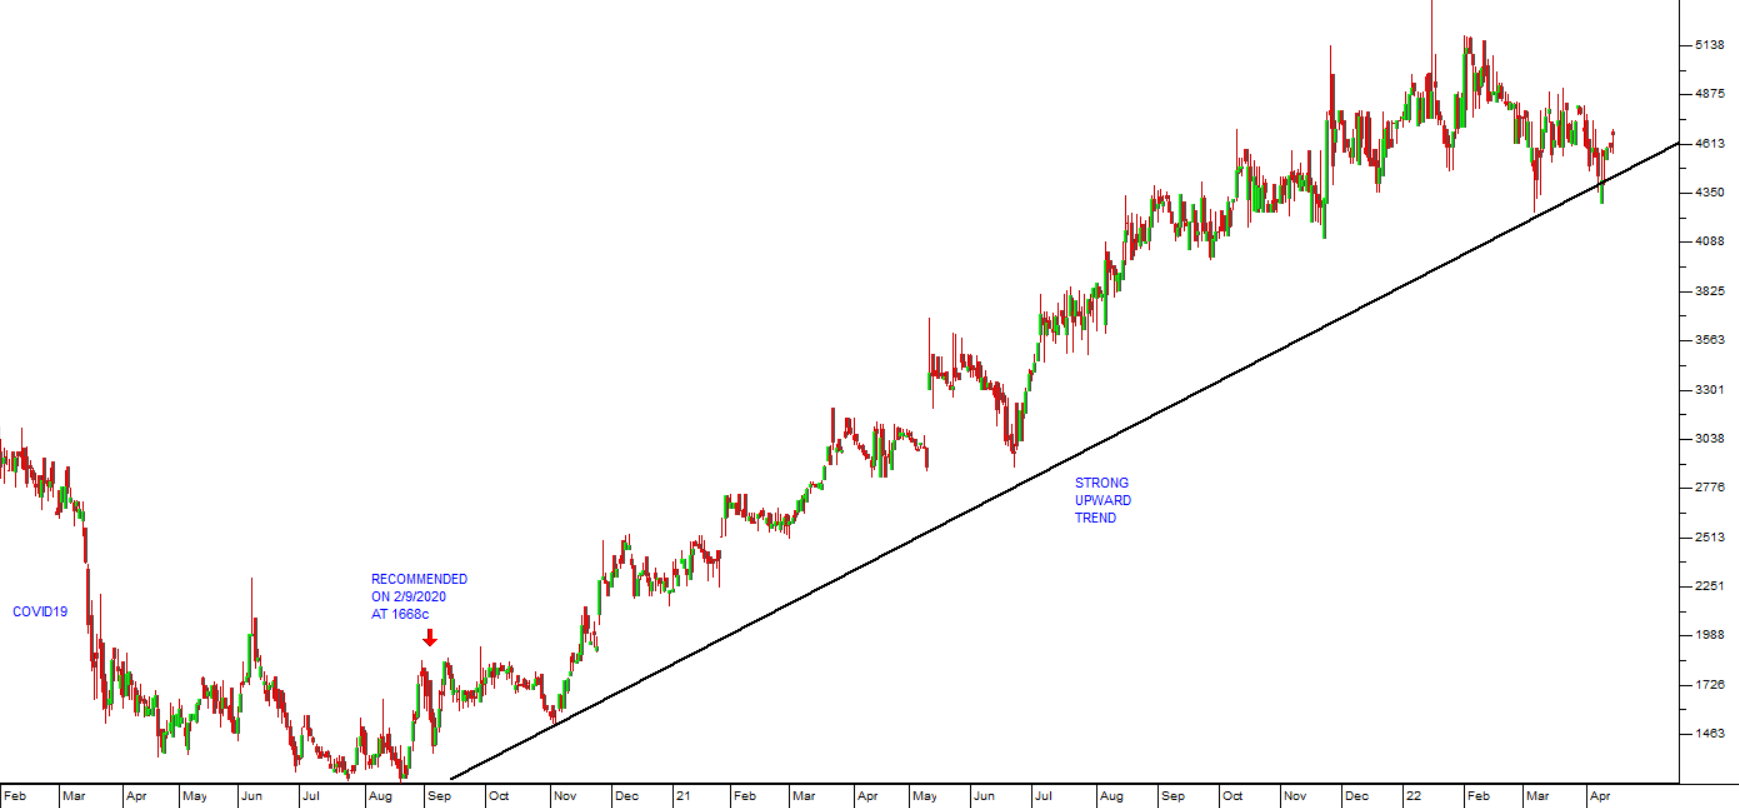
You can see here the recommendation that we made to buy this share in September 2020. You can also see that the share is currently trading close to its trend line which means that it is at a cycle low point. We believe that this share will continue to perform well, and since it is debt-free, the risks of buying it remain extremely low.
DISCLAIMER
All information and data contained within the PDSnet Articles is for informational purposes only. PDSnet makes no representations as to the accuracy, completeness, suitability, or validity, of any information, and shall not be liable for any errors, omissions, or any losses, injuries, or damages arising from its display or use. Information in the PDSnet Articles are based on the author’s opinion and experience and should not be considered professional financial investment advice. The ideas and strategies should never be used without first assessing your own personal and financial situation, or without consulting a financial professional. Thoughts and opinions will also change from time to time as more information is accumulated. PDSnet reserves the right to delete any comment or opinion for any reason.
Share this article: