Gold and Harmony
25 March 2024 By PDSNETIn our last Confidential Report, published on 6th March 2024, we drew your attention to the fact that the US dollar price of gold was about to break up through a critical resistance level at $2060. Gold has now moved up to $2166 so this observation provided an opportunity for private investors to make a significant capital gain, either in actual gold or in specific gold shares.
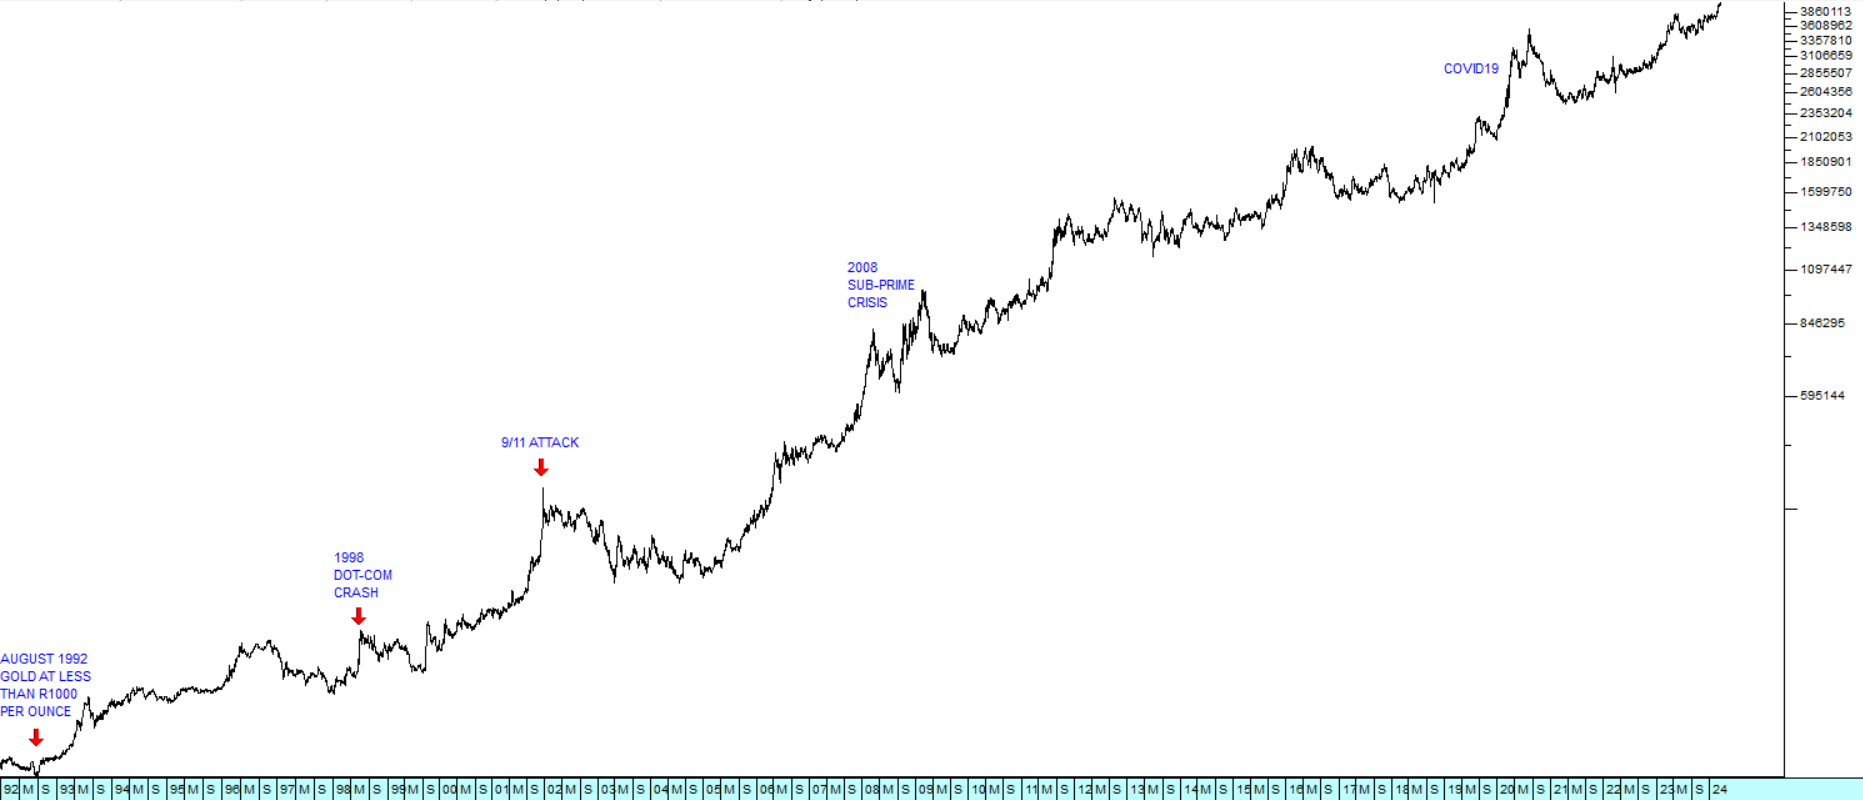
Over the long term, gold has always offered an excellent hedge against the weakness of paper currencies and international political risk. The rand’s steady decline against the US dollar over the past 32 years is reflected in the rand price of gold which has gone from less than R1000 per ounce in August 1992 to current levels above R41000. Consider the chart:
One of the ways to capitalise on the steady rise in the rand price of gold is to buy krugerrands and they have performed very well as mechanism to protect your wealth against all the uncertainty and mismanagement which have become endemic features of the South African economy over the past three decades.
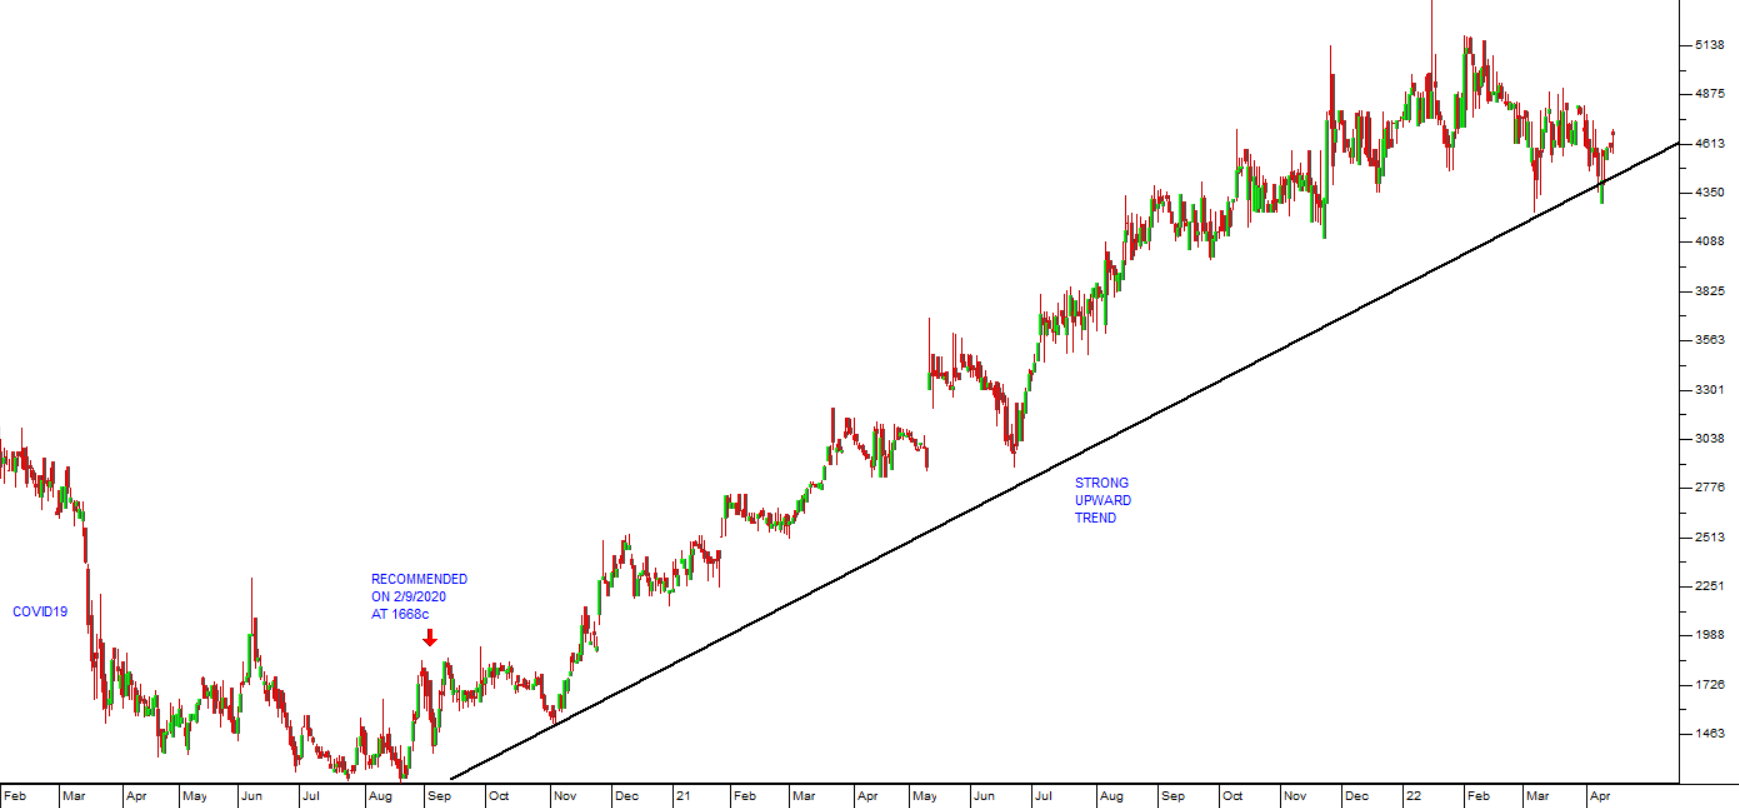
For those investors who have more risk appetite, there was always the option of buying the shares of those gold mining companies with good prospects. One such company is Harmony Gold. This mine used to be one of South Africa’s most marginal gold mines and the share was whip-lashed back and forth as the gold price went up and down.
Then in 2021 it bought the Mponeng gold mine for R4,2bn. Mponeng has the dubious distinction of being the deepest mine in the world – which obviously made it relatively risky. The benefit is that the deeper the mine in South Africa, generally the higher the recovered grade. This is because South African gold exists in conglomerate form as part an ancient sea-bed. Being a heavy metal, gold tended to sink to the bottom of that sea – so the best grades are found at the deepest levels.
Clearly, the directors of Harmony took a huge risk in buying Mponeng gold mine - which the late Brett Kebble once described as the “...the world’s most expensive long-drop.” Their gamble has paid off handsomely, especially in the last year because the recovered grade from Mponeng is reaching 9 grams per ton, resulting in a 30% increase in gold production. Harmony’s headline earnings per share (HEPS) in their latest financials for the six months to 31st December 2023 was up 226%.
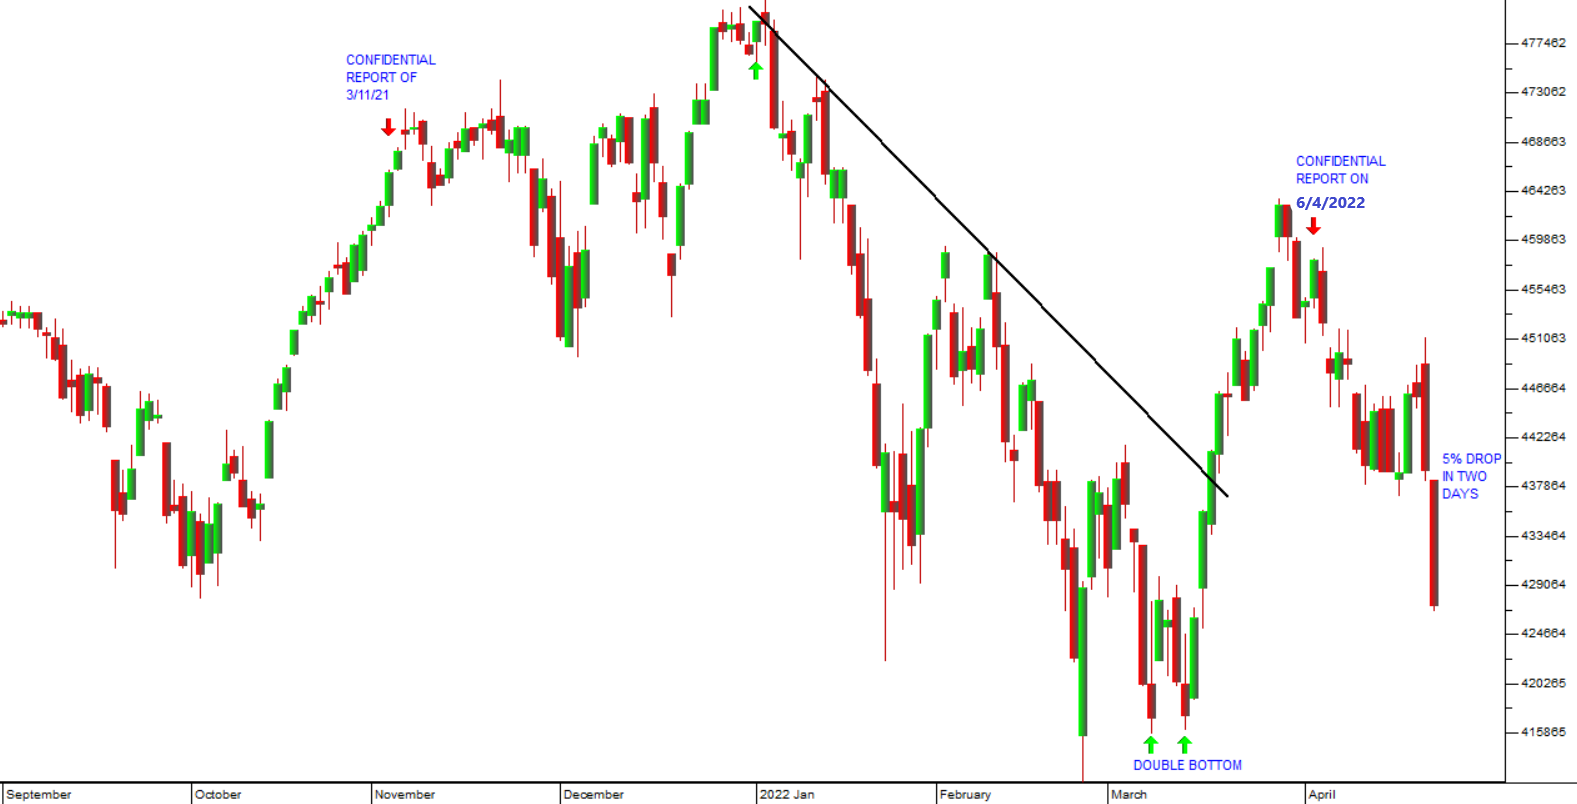
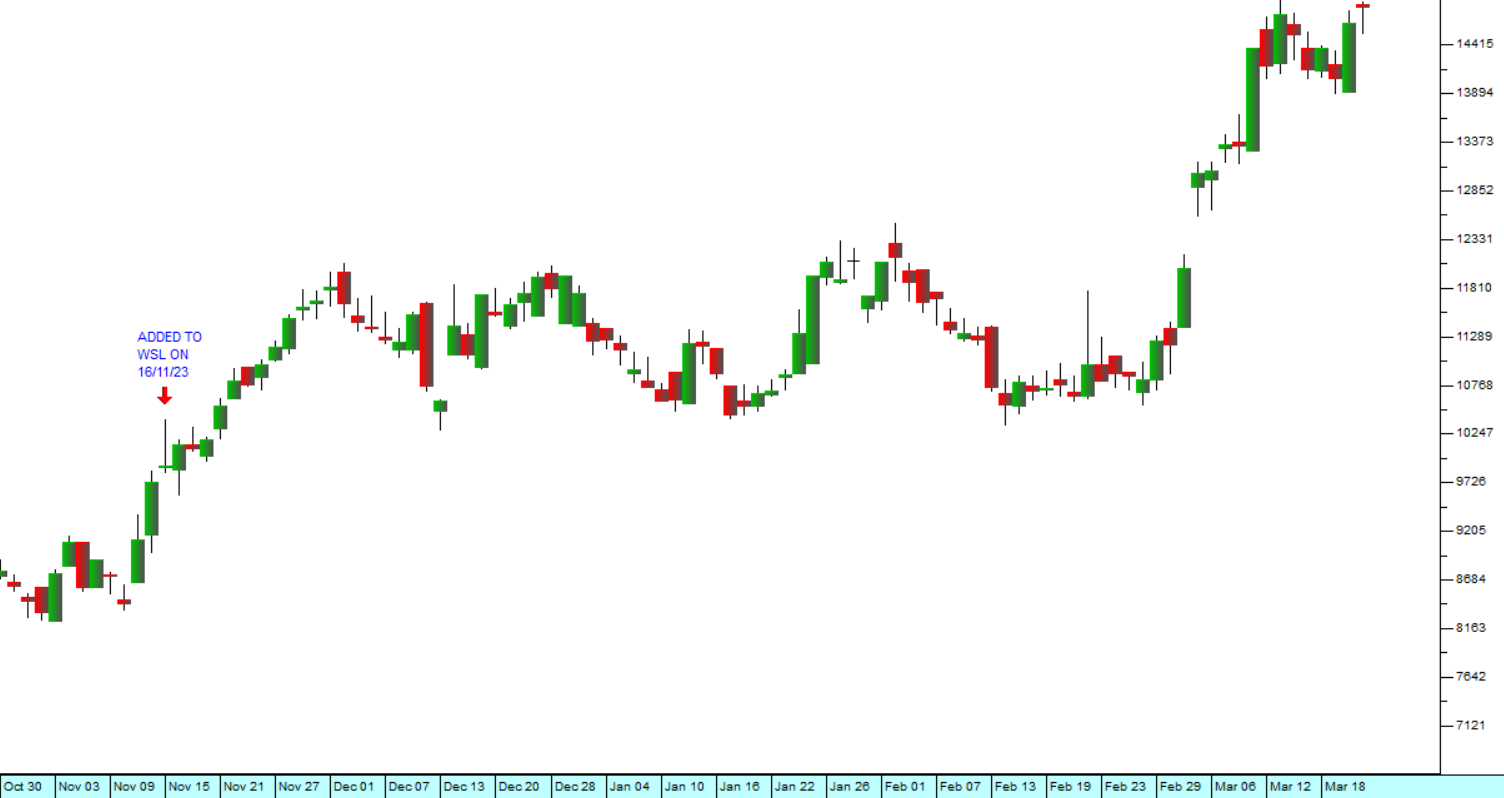
We added Harmony to the Winning Shares List on 16th November 2023 at a price of 9920c per share. It closed last Friday (22-3-24) at 14829c – a gain of 43,97% in just over 4 months. Consider the chart:
DISCLAIMER
All information and data contained within the PDSnet Articles is for informational purposes only. PDSnet makes no representations as to the accuracy, completeness, suitability, or validity, of any information, and shall not be liable for any errors, omissions, or any losses, injuries, or damages arising from its display or use. Information in the PDSnet Articles are based on the author’s opinion and experience and should not be considered professional financial investment advice. The ideas and strategies should never be used without first assessing your own personal and financial situation, or without consulting a financial professional. Thoughts and opinions will also change from time to time as more information is accumulated. PDSnet reserves the right to delete any comment or opinion for any reason.
Share this article: