Pan African Resources
13 May 2024 By PDSNETIn our opinion, the gold price in US dollars should continue to perform well for the rest of 2024 with the potential for rising inflation and increasing political instability in various parts of the world. The upward trend will, of course, be marked by corrections, but the overall direction of the trend is clear. Consider the chart:
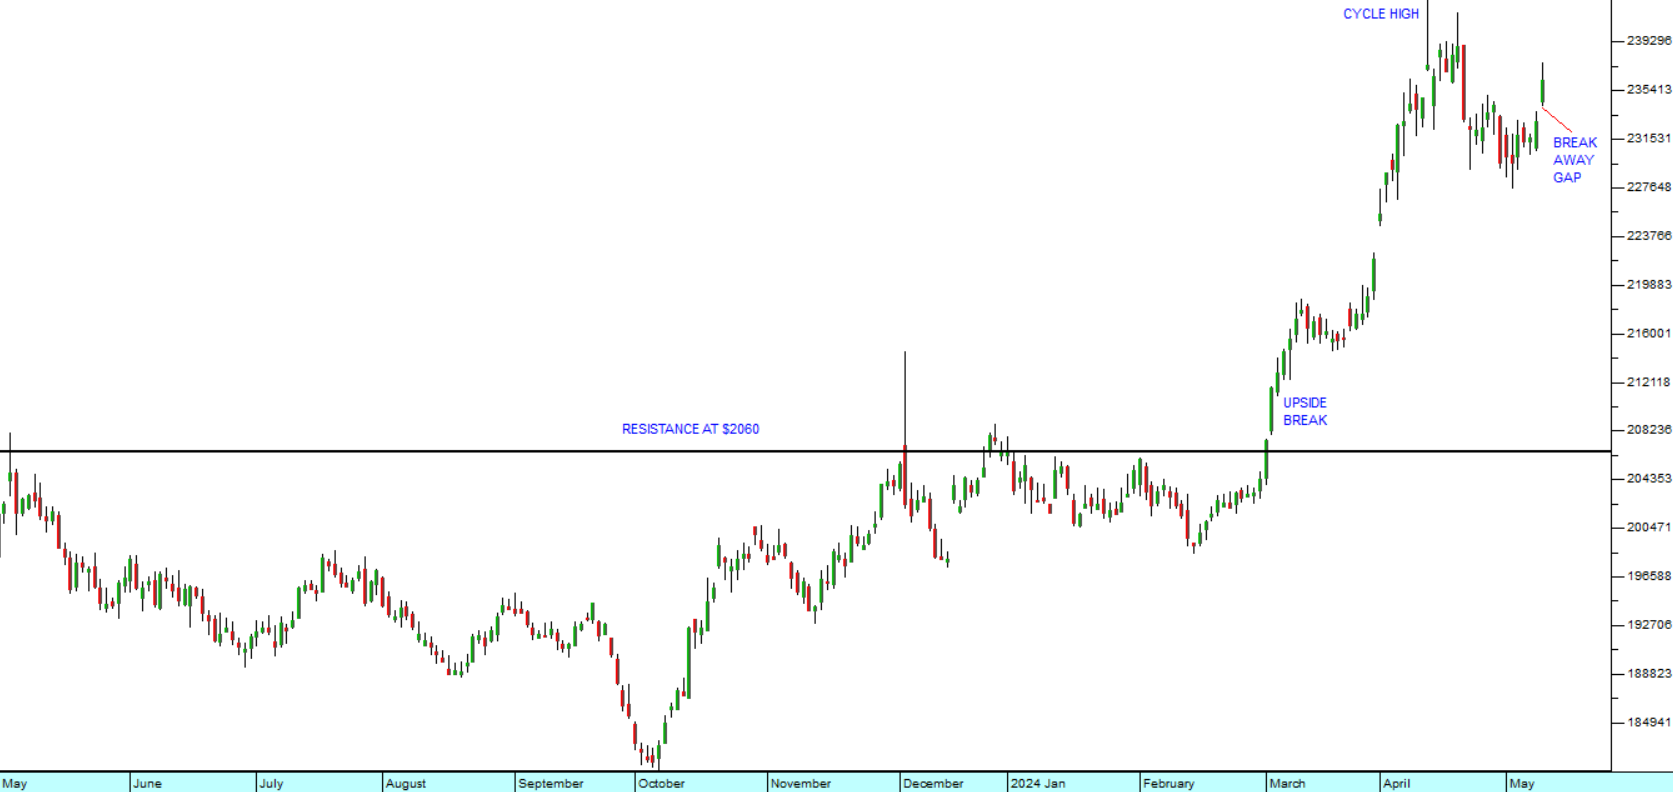
You can see here the upside break above long-term resistance at $2060 which happened in March this year. That was followed by a sharp upward move which took the gold price up to a cycle high in April 2024, marked by a “shooting star” formation. Then there was a brief correction which now appears to have ended abruptly with last Friday’s sharp upward move marked by a break-away gap.
To capitalise on this development we have recommended that investors buy into the various low-cost gold producers available on the JSE. One of the most exciting of these is Pan African Resources (PAN).
Pan African has become one of the lowest cost producers of gold in South Africa. In its latest guidance for the year to 30th June 2024 the company has estimated that its all-in sustaining cost (AISC) will be between $1325 and $1350 – which should be compared with the current gold price of $2364. This means that the company has a very wide profit margin of over $1000 per ounce, making it hugely profitable.
A substantial proportion of Pan African’s production comes from the re-processing of old mine dumps using modern technology. This type of mining is obviously less costly than underground operations and it has the advantage that the precise grade available can be easily ascertained. Underground operations, aside from being very costly, are subject to many uncertainties like faulting, the friability of the rock being mined, flooding and cooling problems.
While Pan African is benefiting directly from the rise in the US dollar price of gold, its solid profit margin means that it is not very vulnerable to a decline in that price. It has become a relatively heavyweight producer – which means that its share price is far less volatile than other more marginal operations.
The mine has also benefited from the steady fall in the rand against the US dollar over the past three years. In June 2021 the rand was R13.50 to the US dollar and now it is R18.43. This has made an investment in Pan African a very effective rand hedge. Consider the chart:
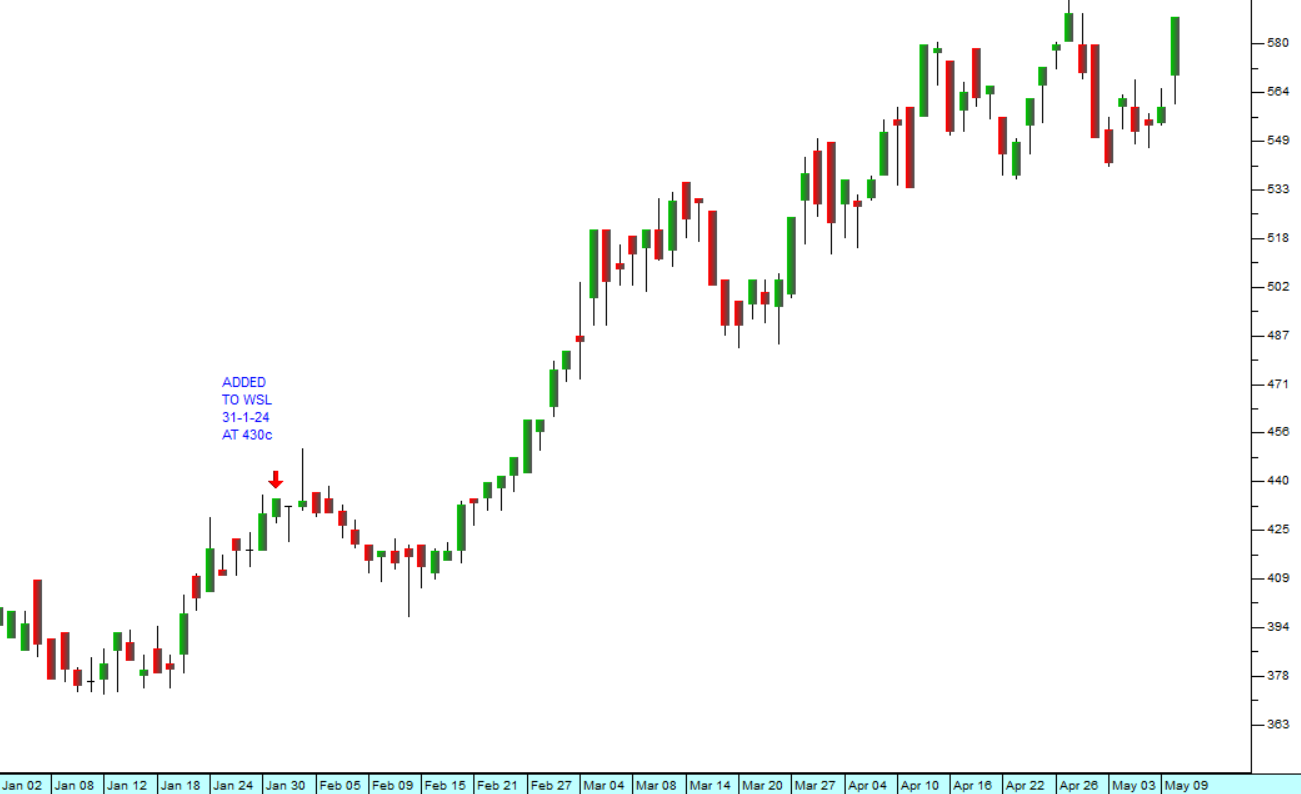
We first recommended Pan African when we added it to the Winning Shares List (WSL) on 31st January 2024 at a price of 430c per share. The share has subsequently risen to 589c – a gain of 37% in just three-and-a-half months.
Postscript
We added Mixtel to the WSL on 28th December 2023 at 590c per share. In the subsequent merger with Powerfleet, Mixtel shareholders received 0,12762 Powerfleet shares for every Mixtel share that they held. Powerfleet closed at 9560c on Friday last week – which means that anyone who bought Mixtel at 590c on 28-12-23 would by now be showing a profit on their investment of 106,78% in a period of four -and-a-half months. See our article “Reverse Takeover”.
Note: If you had bought 1000 Mixtel on the 28th of December at 590c each at a cost of R5900, you would have got 127.62 Powerfleet Shares which would now be worth R95.60 each or R12 200 in total. Your profit would be R6300 which is 106.78%, based on your initial investment of R5900.
DISCLAIMER
All information and data contained within the PDSnet Articles is for informational purposes only. PDSnet makes no representations as to the accuracy, completeness, suitability, or validity, of any information, and shall not be liable for any errors, omissions, or any losses, injuries, or damages arising from its display or use. Information in the PDSnet Articles are based on the author’s opinion and experience and should not be considered professional financial investment advice. The ideas and strategies should never be used without first assessing your own personal and financial situation, or without consulting a financial professional. Thoughts and opinions will also change from time to time as more information is accumulated. PDSnet reserves the right to delete any comment or opinion for any reason.
Share this article: