Market Correction
24 January 2022 By PDSNETOn Friday, the S&P500 index fell about 1,9% - and that was the fourth consecutive day’s fall – which took this correction to 8,3% from the record high of 4796,56 made on 3rd January 2022. That makes it is by far the largest correction in the 20 months since the COVID-19 V-Bottom in March 2020. Consider the chart:
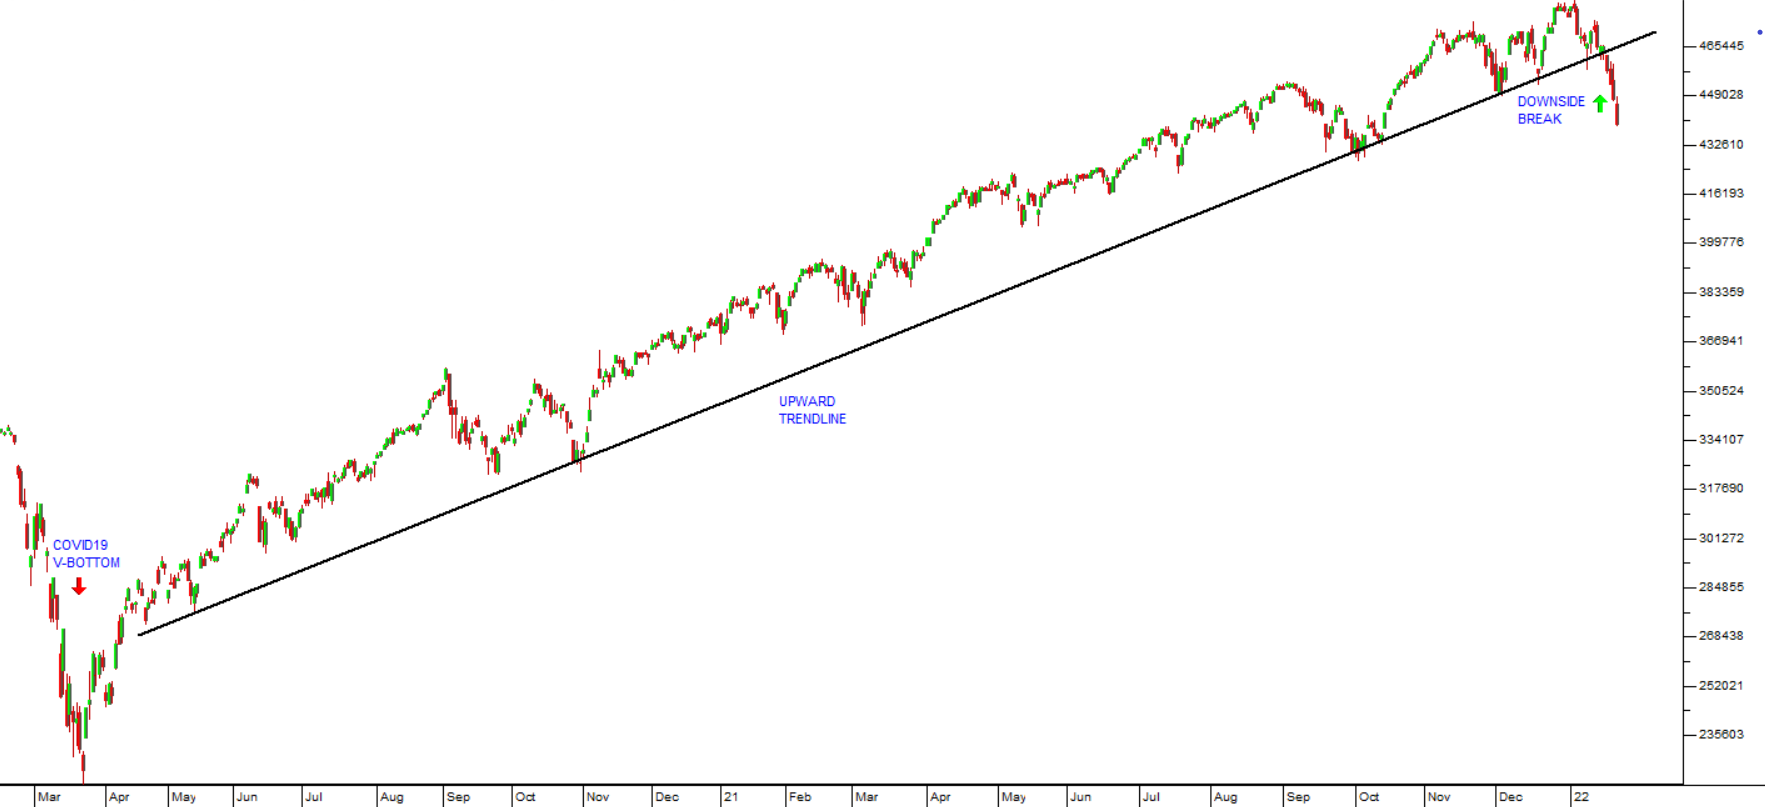
You can see here that the S&P had been moving up very steadily with only small mini-corrections. A well-supported trendline connected at least 5 cycle bottoms. Those mini-corrections were increasingly seen as buying opportunities with many investors just “buying the dips” in order to profit from the inevitable subsequent rise to a new record high.
The current correction is qualitatively different. Not only has the market fallen further, but it has also fallen far more sharply, with a noticeable absence of buyers looking to pick up bargains at the bottom. So now it is necessary to ask whether this is a long-overdue major correction of between 10% and 20% - or possibly even the start of a bear trend.
In our previous articles, we have consistently warned of a major correction of between 10% and 20% for the past few months – and to us this looks like it may well be it. If we are right, you can expect the S&P to fall to somewhere between 4300 and 3800 – with a similar impact on the JSE.
But we definitely see this as a correction - and not the start of a new bear trend. The fundamentals of the US economy still appear to us to be too strong for a bear trend. We believe that interest rates in the US will have to rise to somewhere between 3% and 4% at least before the profits of S&P500 companies are significantly affected.
In our experience, private investors usually spend most of their time on unsystematic rather than systematic factors. In other words, they are preoccupied with the detail of which share they are going to buy and when, and spend little or no time considering the direction of the market as a whole. This is particularly true when the market has been in a long bull trend - as it has now - for almost the past 13 years. There is a tendency to become blasé about corrections.
We suggest that you develop a strategy to identify and deal with the bear trend when it comes. Choose a mechanism for determining when the market has switched from bull to bear - like the slope of a long-dated (say 300-day) moving average of the S&P500 index. Obviously, if you have a strict stop-loss strategy you will get out of shares as the market starts to fall, but sometimes at the start of a great bear trend the market can fall very abruptly. It fell 11% on a single day at the start of the 1929 crash and 23% on a single day at the start of the 1987 crash.
DISCLAIMER
All information and data contained within the PDSnet Articles is for informational purposes only. PDSnet makes no representations as to the accuracy, completeness, suitability, or validity, of any information, and shall not be liable for any errors, omissions, or any losses, injuries, or damages arising from its display or use. Information in the PDSnet Articles are based on the author’s opinion and experience and should not be considered professional financial investment advice. The ideas and strategies should never be used without first assessing your own personal and financial situation, or without consulting a financial professional. Thoughts and opinions will also change from time to time as more information is accumulated. PDSnet reserves the right to delete any comment or opinion for any reason.
Share this article:
.png)
.png)