Correction
22 April 2024 By PDSNETThe progress of the S&P500 index of the 500 largest companies on Wall Street is important because stock markets around the world, including the JSE, tend to follow it sooner or later.
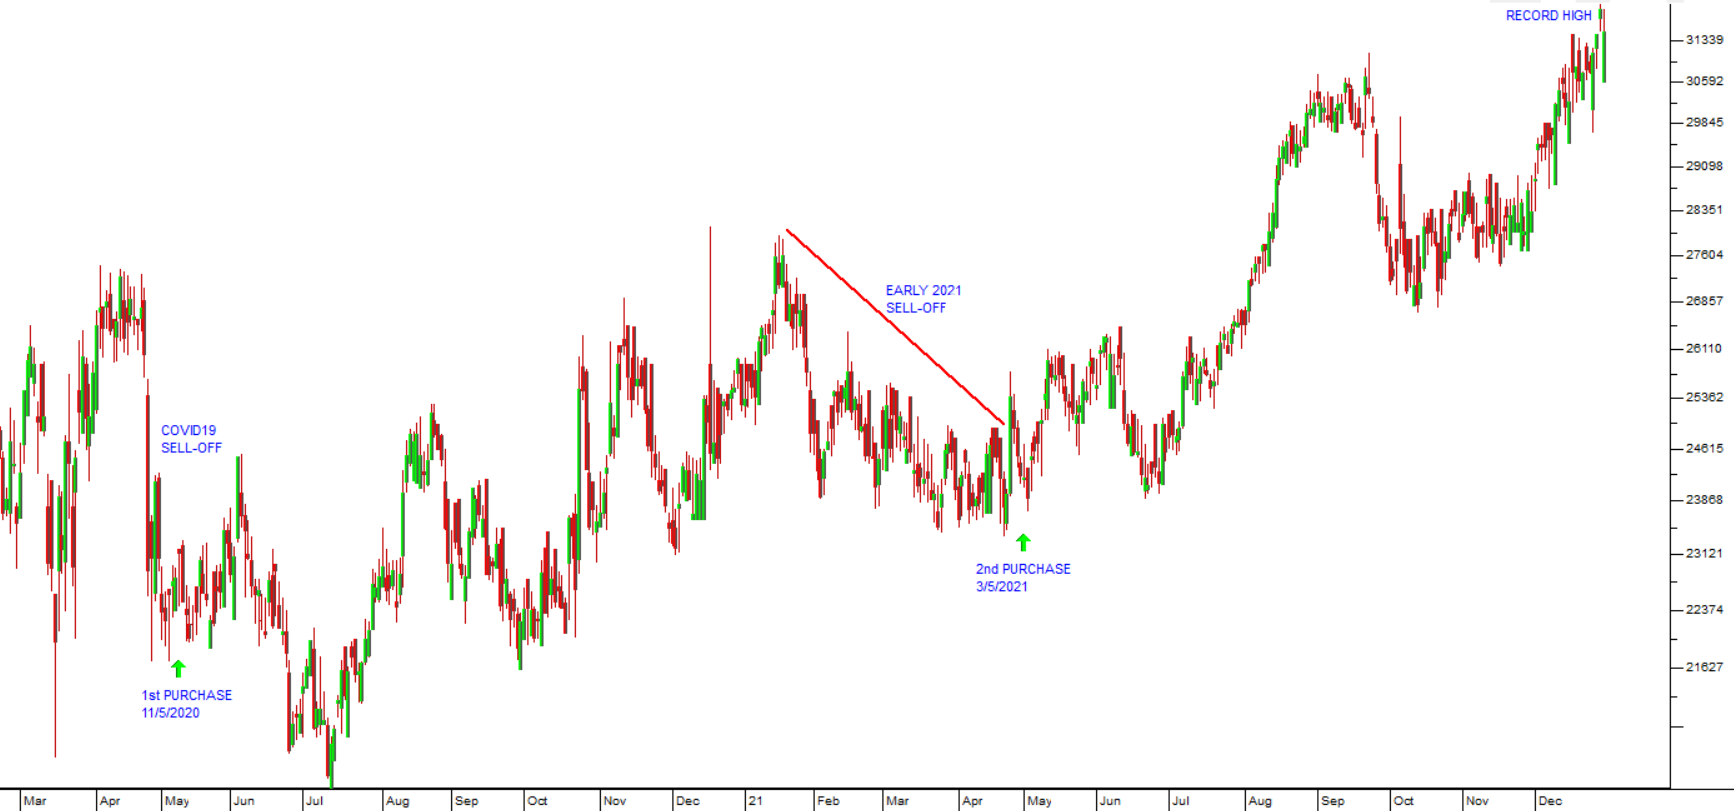
On 19th January this year, something momentous happened when the S&P broke above its previous all-time record high – made almost exactly two years ago at 4796.54. This upside break confirmed that, after the COVID-19 aberration and then the unusually large 25% correction in 2022, the great bull trend which had begun in 2009 was finally continuing.
The upside break gave the bullish optimists on Wall Street a licence to go a little crazy and they drove the index up almost 10% on a tidal wave of optimism to a new record high of 5254 on 28th March 2024. The optimism was built at least in part on overwhelming excitement about the effect of artificial intelligence (AI) in such companies as Nvidia. It was also fuelled by the extraordinary growth in the US economy even in the face of record high interest rates. Consider the chart:
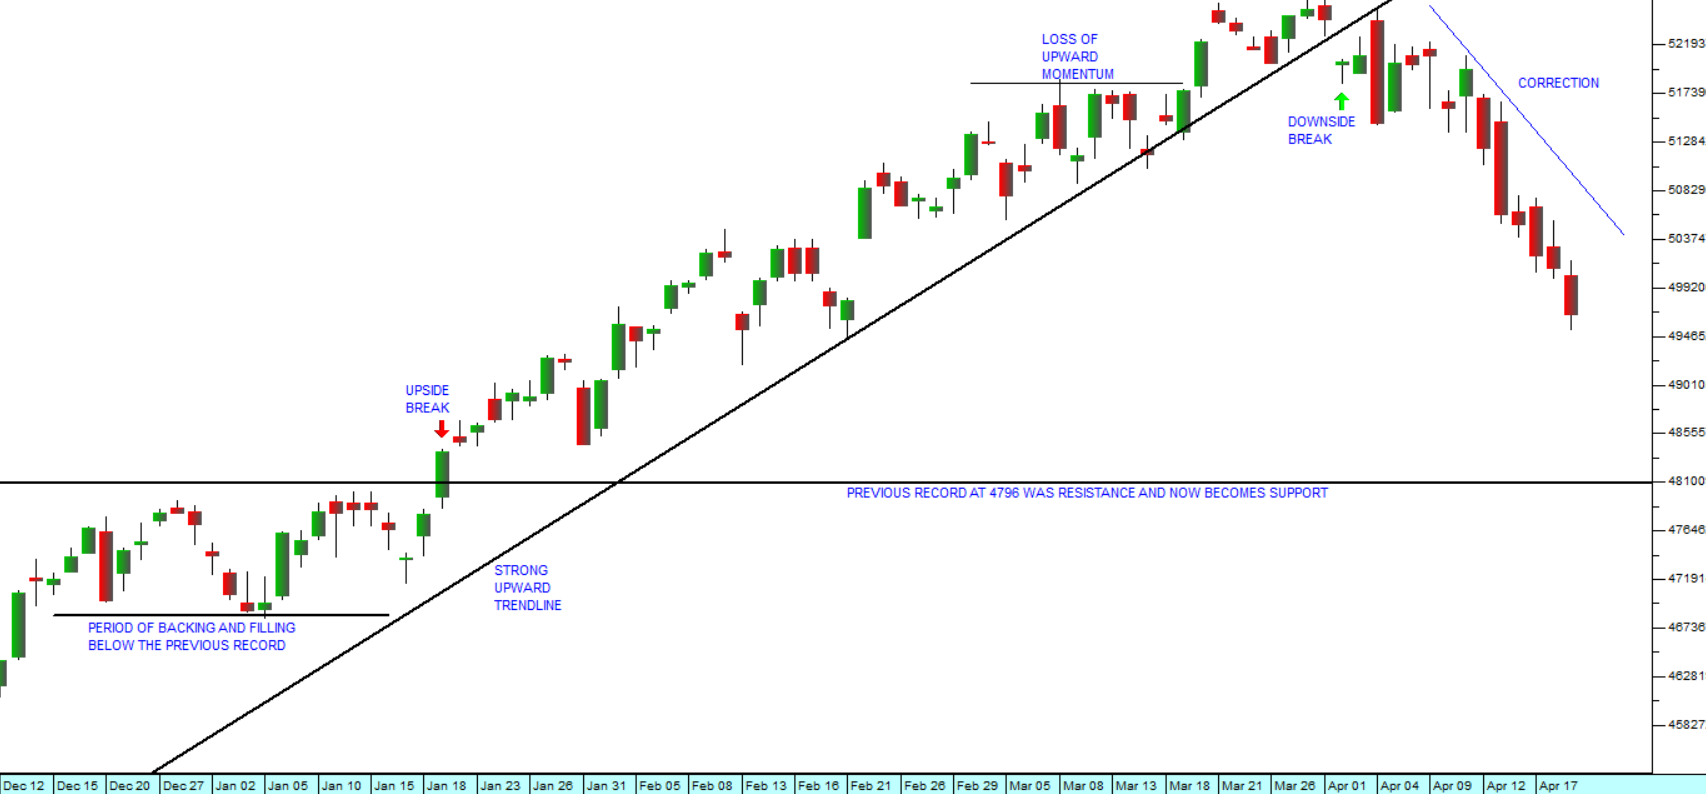
You can see here that, after some backing and filling, the S&P500 index broke above the previous record high of 4796 set on 3rd January 2022. What followed was an extraordinary display of bullishness and a very strong upward trend. This upward trend began to run into difficulties in mid-March 2024 and finally ran out of steam at its closing peak of 5254 at the end of that month.
We had by then for some time been warning of an impending correction – which we said would probably take the index back to its previous record high of 4796. It is quite common for a previous resistance level, once it is penetrated, to become the support level in an upward trend.
The market action still indicates a significant amount of investor bullishness. There are still plenty of frustrated bulls looking to “buy the bottom” – but right now this overdue correction is just too strong for them.
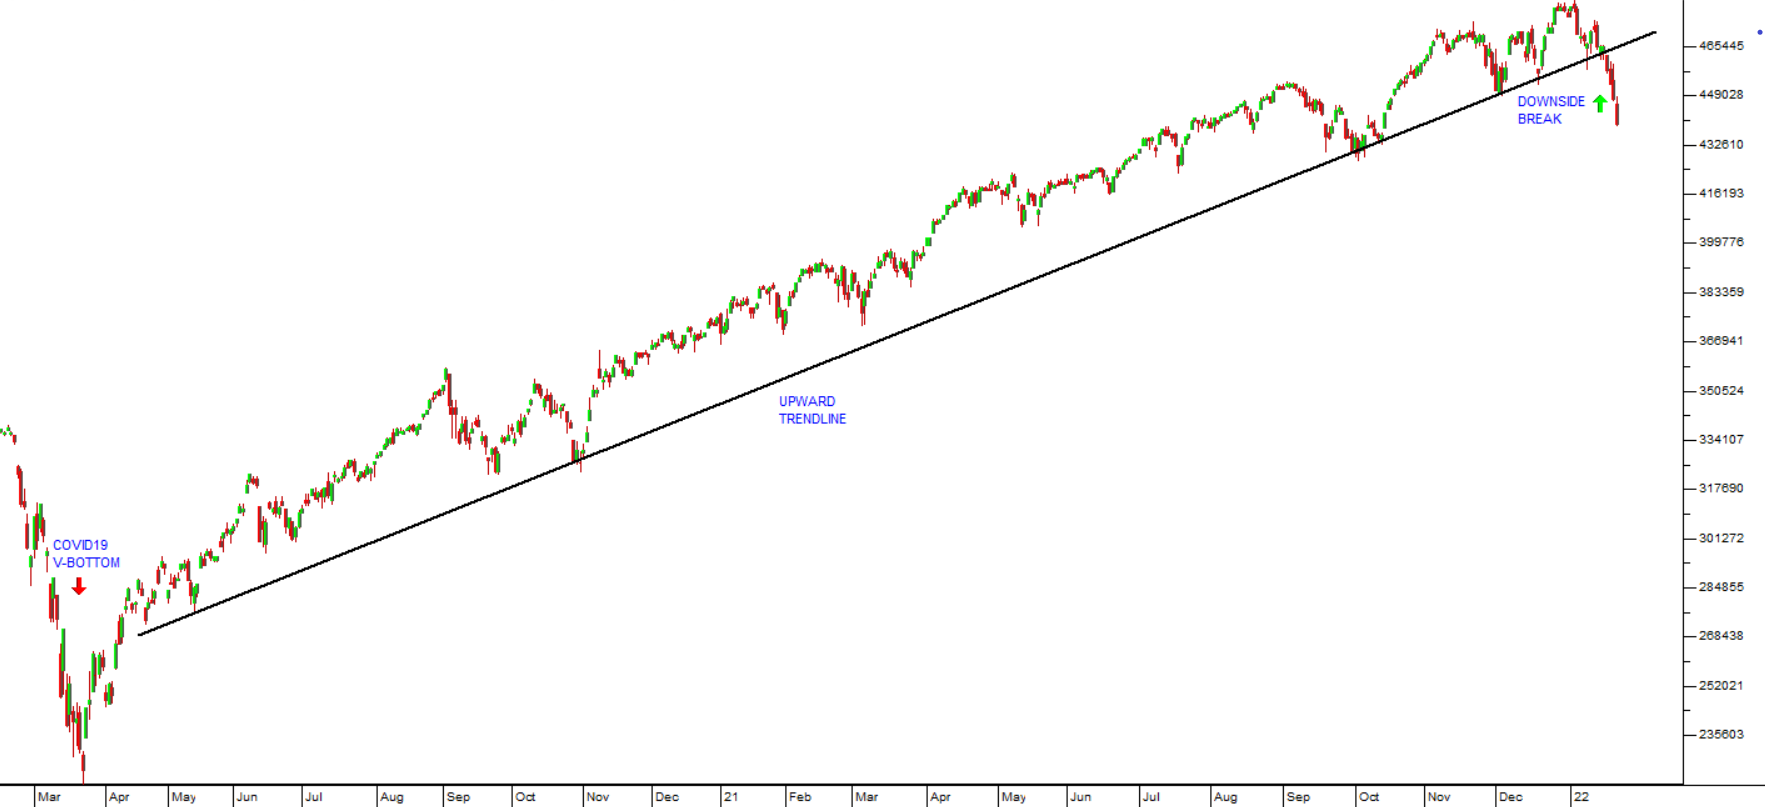
So far, the index has fallen about 5,5% - but we expect that it will probably fall further to somewhere close to resistance at that previous record high of 4796. Within the correction you should expect some small rallies – nothing in the markets moves in a straight line! On that point, it is rare for the S&P500 to fall on six consecutive days as it has just done, so we expect it to go up on Monday the 22nd of April 2024.
From a fundamental perspective, the US monetary policy committee (MPC) having held rates unchanged at its latest meeting is talking about rates having to remain high for longer. The first rate cuts are now only expected at the September meeting.
The fact that the US economy created 303 000 new jobs in March 2024 shows that it is still far from cooling down despite the fact that rates have been at record levels for a while.
The correction on Wall Street is being followed around the world on other markets. London (FTSE250) is down 2,7%, the German Dax is down 4% and the Nikkei in Japan is down 9,3%. The JSE, although generally more volatile, is about 5% off its recent highs.
In our opinion, this is not the start of a bear trend. It is simply a normal, healthy correction within the long-term bull trend. It will almost certainly end fairly soon and then the S&P500 will go on to break up a new record high.
DISCLAIMER
All information and data contained within the PDSnet Articles is for informational purposes only. PDSnet makes no representations as to the accuracy, completeness, suitability, or validity, of any information, and shall not be liable for any errors, omissions, or any losses, injuries, or damages arising from its display or use. Information in the PDSnet Articles are based on the author’s opinion and experience and should not be considered professional financial investment advice. The ideas and strategies should never be used without first assessing your own personal and financial situation, or without consulting a financial professional. Thoughts and opinions will also change from time to time as more information is accumulated. PDSnet reserves the right to delete any comment or opinion for any reason.
Share this article:
.png)
.png)