Wall Street and the Rand
20 May 2024 By PDSNETAs South Africa edges closer to election day, the ANC has been desperately doing everything in its power to pass populist measures to bolster its waning support, especially with the country’s lower income groups. This includes the signing of the highly controversial National Health Insurance (NHI) bill into law by President Ramaphosa.
There has also been a sudden improvement in Eskom’s performance which is being touted by the ruling party as evidence of their effectiveness and ability to govern. The reality, however, is that the sharp increase in Eskom’s energy availability factor (EAF) is more a result of the massive investment in renewable energy by the private sector over the last year.
At the same time the rand has been strengthening steadily against first world currencies, which implies a significant inflow of investment capital from overseas investors. Consider the chart:
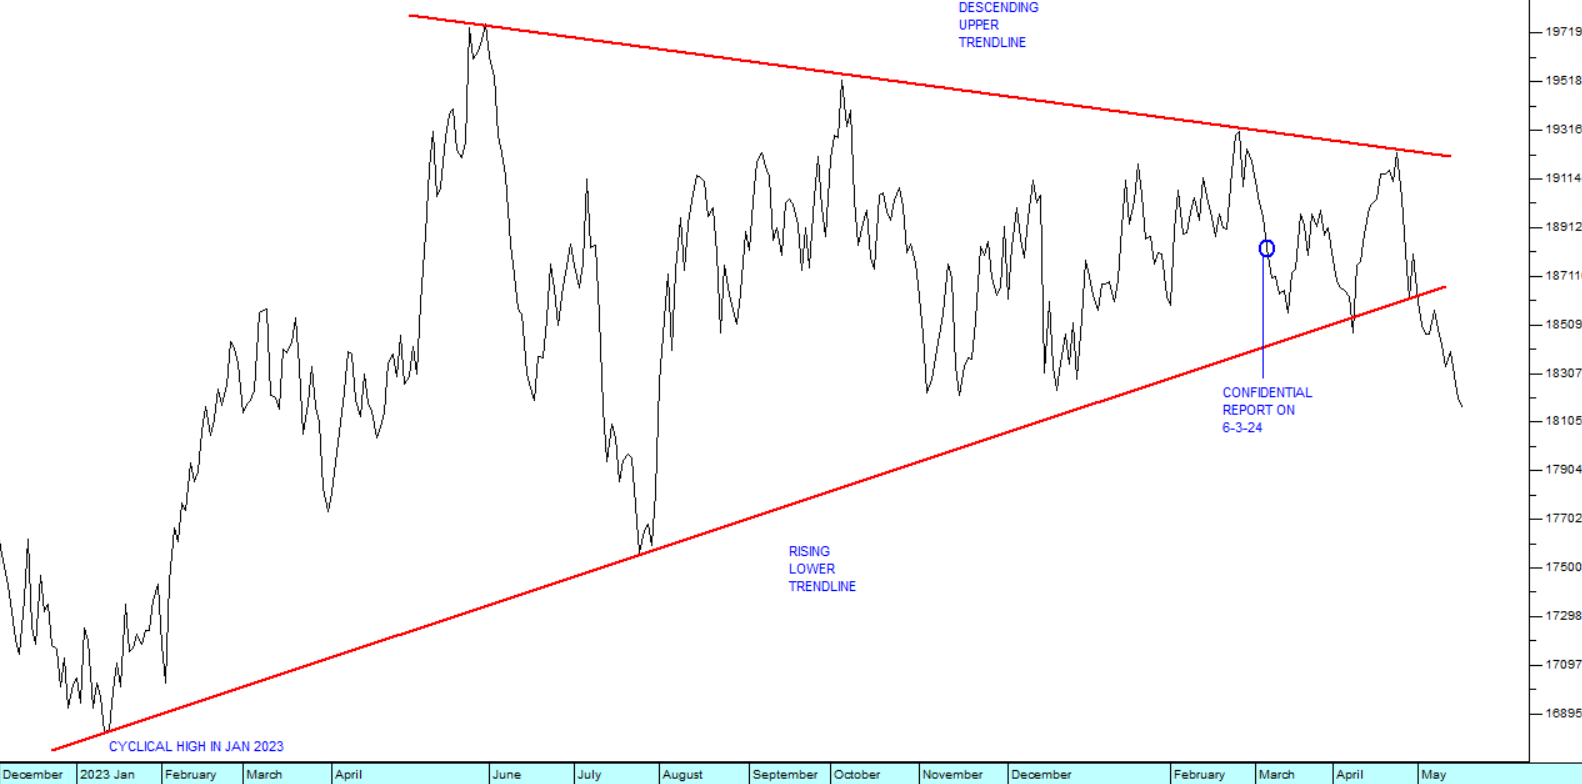
You can see here the triangle formation in the rand/US dollar exchange rate which has been developing since its cyclical strong point at beginning of 2023. We pointed this formation out in our Confidential Report published on the 6th of March 2024 and suggested that whichever way the rand broke out of the triangle would signal its future direction.
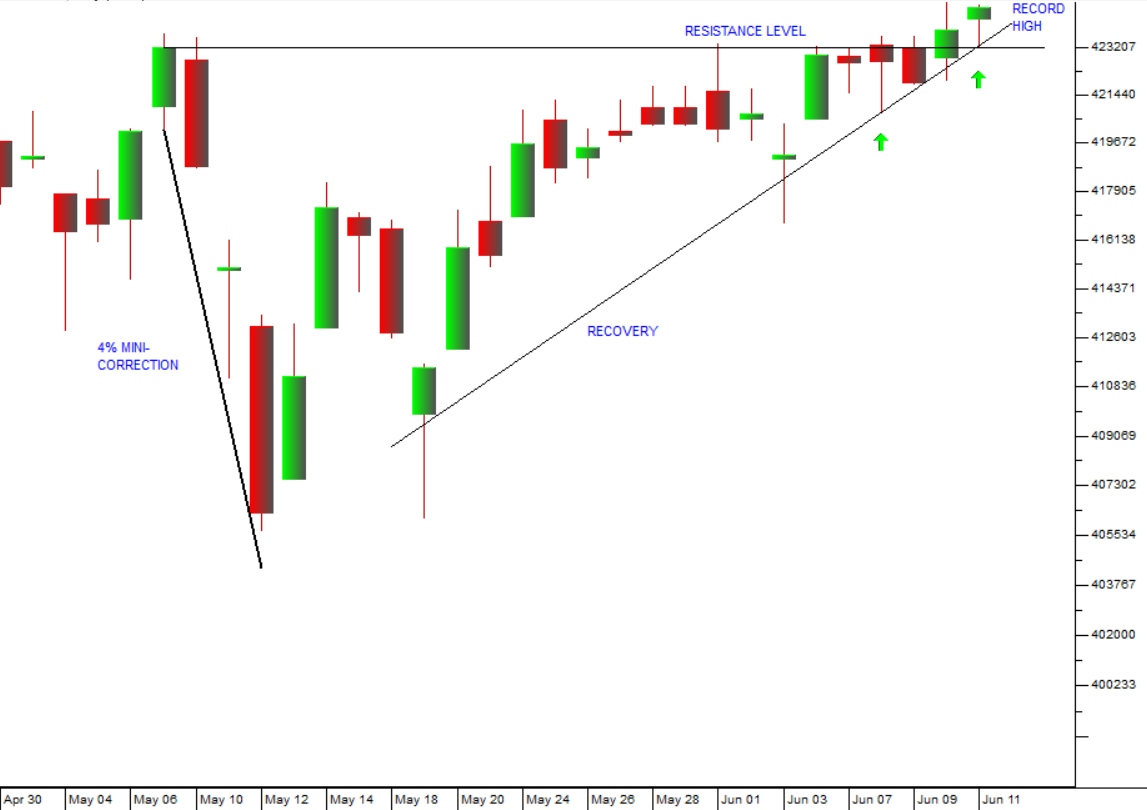
Now you can see that the rand, having broken strongly through the lower trendline, is appreciating rapidly. You may be tempted to think that this is because of the ANC’s pre-election activities. The reality, however, is that the stronger rand is almost certainly as a result of the major shift in international sentiment towards emerging markets following a series of new all-time record highs on Wall Street. Consider the chart of the S&P500 index:
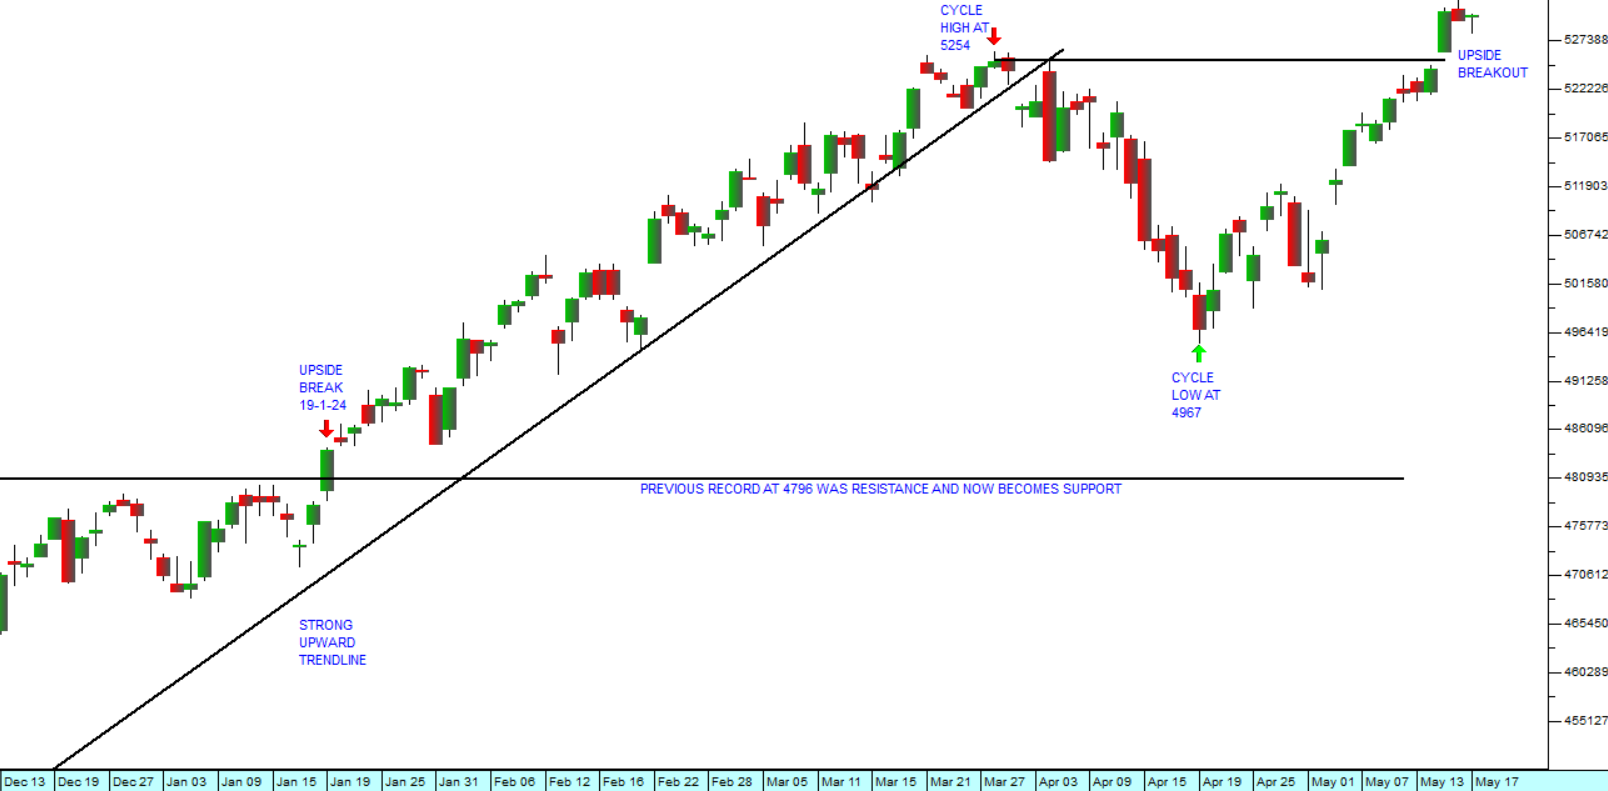
The chart shows how the S&P broke strongly above resistance at its previous all-time record high on the 19th of January 2024. It reached a cycle high at 5254 on the 28th of March and then began a long-overdue correction. The correction took it down to a cycle low of 4967 made on the 19th of April 2024.
Our expectation was that the correction would take the index back to the resistance at the previous all-time record high of 4796, and we see the actual higher cycle low as a clear indication of the excessive bullishness which currently exists on Wall Street.
The correction was completed in just 6 weeks when the index broke to a new all-time record high on the 15th of May 2024. Notably, that upside break was accompanied with a break-away gap – a further sign of high levels of underlying bullishness in the market.
We have previously drawn attention to the fact that bullish sentiment in international markets results in a shift from “risk-off” to “risk-on” and that has had a notable impact on emerging market currencies – particularly on the rand. Our point is that the strengthening rand is almost certainly not a result of anything positive done by the ANC in the run-up to the local election. It is mostly a result of a coincidental strong shift in international investor sentiment.
Right now, the situation on the ground in South Africa is at best a mixed bag for international investors. On the one hand, loadshedding has stopped and that is having a positive impact on the economy. On the other, the election may well result in a period of relative political instability as the various parties jostle for power in a new coalition government.
DISCLAIMER
All information and data contained within the PDSnet Articles is for informational purposes only. PDSnet makes no representations as to the accuracy, completeness, suitability, or validity, of any information, and shall not be liable for any errors, omissions, or any losses, injuries, or damages arising from its display or use. Information in the PDSnet Articles are based on the author’s opinion and experience and should not be considered professional financial investment advice. The ideas and strategies should never be used without first assessing your own personal and financial situation, or without consulting a financial professional. Thoughts and opinions will also change from time to time as more information is accumulated. PDSnet reserves the right to delete any comment or opinion for any reason.
Share this article:
.png)