Preparation - Response
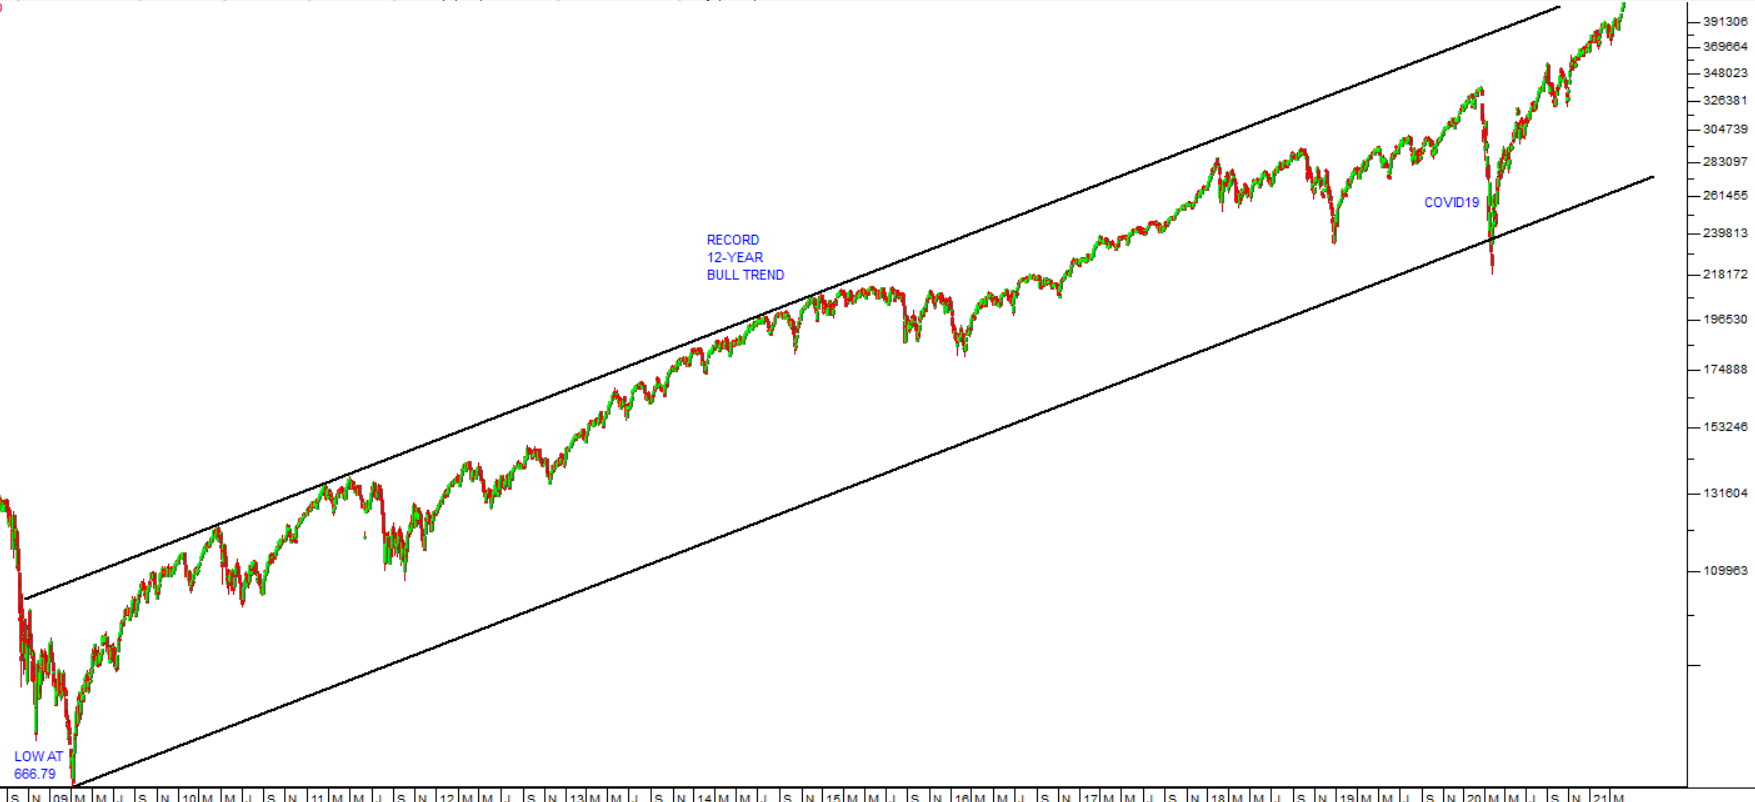
26 April 2021 By PDSNETIn our articles Elimination of the Bears, 12 Year Bull Trend and Top of the Market Signs, we have been talking about the progress and possible future of the great bull trend which is gripping world markets. These articles echo the document “Our Background Approach” which is on the PDSnet website - Click here to read
In this article we will talk about what actions you should take to prepare for what we see as the collapse of markets once this bull market ends – as it inevitably must.
In past articles we have spoken of the bull market being driven by three primary and convergent forces:
- Falling energy prices.
- Rising productivity emanating from new technologies.
- Massive monetary stimulation and fiscal stimulation of the world economy.
The first two of these factors have effectively kept inflation under control, leaving governments free to engage in the third. In the process, debt levels have been driven to unprecedented levels.
We believe that this path is unsustainable because eventually debts are always settled, by the debtor either repaying or by his default - in which case the creditor effectively bears the cost. And repayment, in whatever form it takes, must certainly result in a commensurate contraction in spending, economic growth, and hence stock markets.
It is clear that this contraction will be much bigger than the 1929 crash, because it has been repeatedly postponed and put off since 1987 by the use of stimulatory monetary policies. Debt levels are much, much higher. In 1987 the US government debt was around $3,5 trillion, today it is well over $28 trillion and growing.
We expect the world economy to now enter a period of rising inflation – which will ultimately have to be controlled by raising interest rates as governments around the world try desperately to put the inflation genie back into the bottle.
Exactly when markets will respond to this uncertain. The initial interest rate increases will probably not be sufficient to derail the bull, but eventually they will. Already, there is some early evidence that inflation is beginning to rise in America, edging above the Federal Reserve Bank’s 2% goal.
So, how should you prepare for the coming bear trend and how should you respond when it begins?
A bear trend of this nature is characterised by a widespread loss of consumer and business confidence – similar to what happened after the 2008 sub-prime crisis, but on a much larger scale. In those circumstances, consumers and businesses just stop spending on everything except the most essential items. The spending contraction has the effect of collapsing more businesses and putting more people out of work in a vicious downward cycle.
To prepare for this you should:
- Try to reduce your monthly expenses to a minimum, pay off any debt that you may have and try to live on a fraction of what you earn.
- Try to broaden and diversify your sources of income so that you are not dependent on a single income. In the 1929 crash, unemployment in America reached 33%. We expect this crash to be worse with US unemployment potentially reaching 50%. The best jobs will be the most secure jobs – those in government service or for very large companies with very strong balance sheets.
- Try to pay off debt (such as your mortgage bond) and stockpile cash in a spread of the securest banks.
- Do not be tempted to invest in gold. Gold, along with all other assets (including cryptocurrencies) will collapse. The best asset to hold, at least in the initial stages, will be cash. As the crash progresses and people become more and more desperate, they will strive to liquidate whatever asset they have to survive. This will cause asset prices to fall sharply across the board. The purchasing power of your money will increase dramatically – that is the nature of a deflationary crash. Do not try to swap one collapsing asset (like shares) for another (like gold). All assets will fall against cash – that is the nature of a deflationary crash.
- Watch out for the “dead cat bounce”. Falling markets usually follow an “A-B-C” pattern in which the “B” up-wave recovers about half of what was lost in the initial “A” down-wave. Do not be fooled by this. Hold onto your cash until the market reaches a point of “capitulation”. In the 1929 crash shares on Wall Street eventually off-loaded 89% of their value over two-and-half years. This bear trend when it comes is likely to be worse. Consider the chart of the 1987 crash:
.png)
JSE Overall Index: October 1987-March 1988. Chart by ShareFriend Pro.
Note the A-B-C structure and the point of capitulation. Inevitably, once the market has off-loaded a good deal there is a recovery – but it is usually based on false hope, not reality.
Finally, let us repeat that we do not see this scenario as imminent. It could be as soon as a few years away or it could take another ten years to arrive. We are in uncharted waters and there is really no reliable way of knowing how long the current upward trend in markets will continue.
Watch out for the signs of the top that we have discussed in previous articles and quietly prepare yourself and position yourself to face an extended period of economic contraction.
DISCLAIMER
All information and data contained within the PDSnet Articles is for informational purposes only. PDSnet makes no representations as to the accuracy, completeness, suitability, or validity, of any information, and shall not be liable for any errors, omissions, or any losses, injuries, or damages arising from its display or use. Information in the PDSnet Articles are based on the author’s opinion and experience and should not be considered professional financial investment advice. The ideas and strategies should never be used without first assessing your own personal and financial situation, or without consulting a financial professional. Thoughts and opinions will also change from time to time as more information is accumulated. PDSnet reserves the right to delete any comment or opinion for any reason.
Share this article: