The Great Bull
11 October 2020 By PDSNETWe have often stressed the importance of understanding the long-term context within which the share market is moving. It is very difficult to see what is likely to happen in the future unless you go back in history and study how we arrived at this point. In this context, it is important to understand that, these days, the major markets of the world generally move together – and they all follow Wall Street. Therefore, we can focus our attention on the S&P500 index because ultimately, London, Tokyo, the European markets and the JSE have and will follow what happens there.
On 13th March 2020 when the pandemic was just beginning to impact markets we published an article in which we suggested that the rapid downward trend in markets, and especially the S&P, would almost certainly be “short and sharp” and we described it as a “V-bottom” and therefore a buying opportunity. Click here for article:"Bear Trend ?" Now, with the advantage of hindsight, we can see that is exactly what happened.
And that was not our first prediction about where the S&P would go. Back on 25th November 2016, when the S&P was just above 2200 we published an article in which we gave the results of a point and figure (P&F) analysis of the 2-year sideways market between about October 2014 and November 2016. Click here for article: "Upside Target" This analysis revealed that, having broken clearly up out of that sideways market, the horizontal count suggested that the S&P would rise to at least 3027.
In our experience, horizontal counts are usually at least 70% accurate – except that they usually tend to under-estimate the final target. Consider the chart:
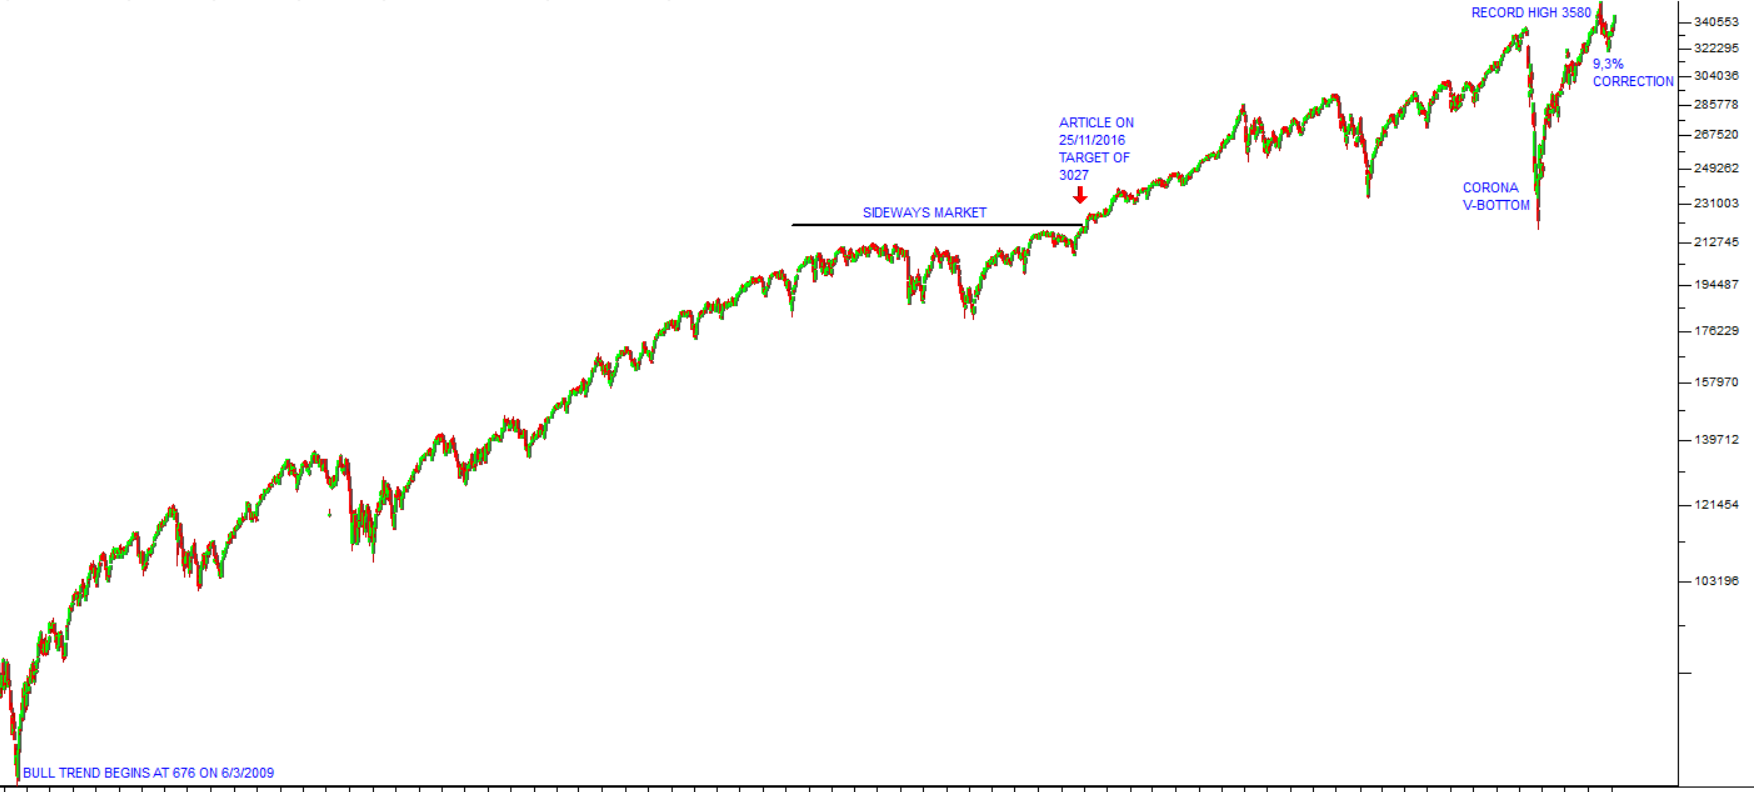
Here you can see the S&P500 index going back to December 2008 when we were in the thick of the sub-prime crisis. On the extreme left-hand side, you can see that the market bottomed on 6th March 2009 at an index level of 676. The sideways market referred to above came six years later and you can see where that article was published at an index level of just over 2200 on 25th November 2016.
The S&P500 went on to reach that target by the end of October 2019 - and then exceed it by a wide margin (which is normal with horizontal counts), reaching an all-time record high of 3580 on 2nd September 2020.
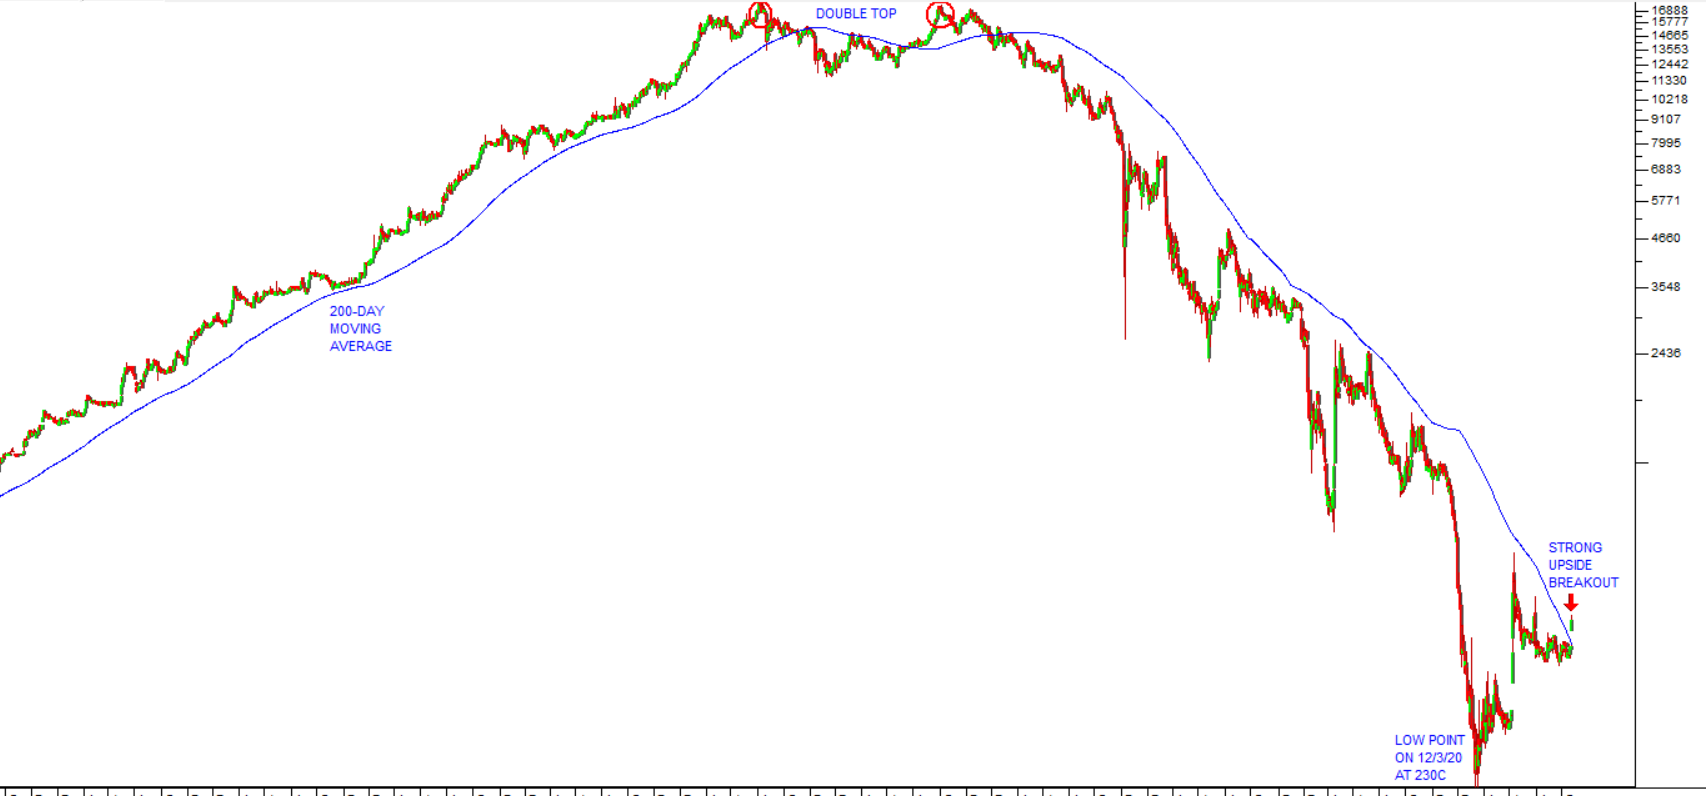
In the middle of all that we have had the corona pandemic which created a massive V-bottom. We always believed that to be an aberration from a technical point of view because its origin did not lie in the economy, but rather in the impact of a completely unrelated “black swan” event. For that reason, we believe that the V-bottom should be ignored for the purposes of analysis – it was not a true bear market. We have always taken the position that the great bull trend that began in March 2009 would continue unabated as soon as the pandemic was effectively behind us – and that is exactly what has happened.
Now, if we examine the events of the last two-and-a half months (i.e. after the V-bottom was completed on 20th July 2020) we can see that the S&P moved rapidly up, making a series of new record highs until 2nd September 2020 – by which time some sort of correction was probably over-due. Trump gave the markets the perfect excuse to cool off when he re-ignited the trade war with China and then there was fear of a 2nd wave of the pandemic which took the market down in a classic correction of 9,3%. That correction now appears to be over and the S&P is gaining ground rapidly. We confidently predict a new all-time record high within the next few weeks.
And this, of course, means that, as a private investor, you should hold on to whatever positions you have in high-quality blue chip shares, and look to expand those positions where quality is cheap (as it is, for example, in the South African banking sector).
DISCLAIMER
All information and data contained within the PDSnet Articles is for informational purposes only. PDSnet makes no representations as to the accuracy, completeness, suitability, or validity, of any information, and shall not be liable for any errors, omissions, or any losses, injuries, or damages arising from its display or use. Information in the PDSnet Articles are based on the author’s opinion and experience and should not be considered professional financial investment advice. The ideas and strategies should never be used without first assessing your own personal and financial situation, or without consulting a financial professional. Thoughts and opinions will also change from time to time as more information is accumulated. PDSnet reserves the right to delete any comment or opinion for any reason.
Share this article: