Horizontal Count on Afrimat
29 May 2019 By PDSNETAfrimat was originally a construction company which specialised in the supply of what are known as “aggregates†to the road-building industry. With the collapse of the construction industry following the 2010 Soccer World Cup, Afrimat set about re-inventing itself to become a mining company.
The decision to rely less on the road-building industry has paid handsome dividends. It began with the acquisition of the Demaneng iron ore mine in the Northern Cape. More recently (on 8th April 2019) it announced that it had put in a firm offer to buy Universal Coal Plc., a company listed in Australia but which has operations in South Africa. Afrimat has offered R2,1bn for the business which mainly supplies coal to Eskom through contracts valid until 2023.
But from a private investor’s point of view, what makes Afrimat really interesting is its extended sideways market going back to mid-October 2016.
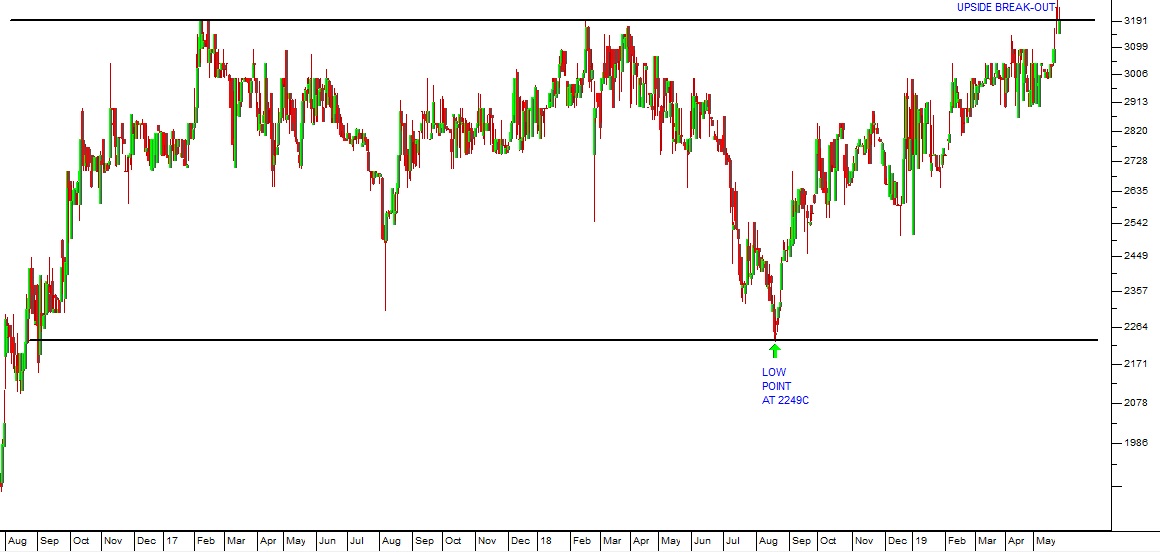
Afrimat (AFT) August 2016 to May 2019 - Chart by ShareFriend Pro
Here you can see a conventional candlestick chart with the extended sideways market defined by upper and lower horizontal lines. The upside break-out is visible in the top right-hand corner. You can also see the low point of the sideways market which occurred at 2249c on 21st August 2018. In a normal market, businesses strive to grow and their share prices reflect that growth over time. But sometimes, when that growth is not reflected in the share price for an extended period because of market uncertainty (as in the case of Afrimat), it results in a build-up of value which is not reflected in the share’s price. Once an upside breakout is achieved from that sideways market there is often a sharp rally. The technique of a horizontal count in Point and Figure charting allows us to measure the upward potential of a break from a sideways market. Point and Figure charting is a very old charting method which strives to exploit the changes in direction of a share’s price. To do this a one-dimensional chart is constructed which measures price on the Y-axis, but does not measure time on the Y-axis. Instead, it measures changes in direction. The following is a point and figure chart taken from Metastock which shows the sideways pattern in Afrimat for the same time period as the chart given above with the upside breakout which happened yesterday.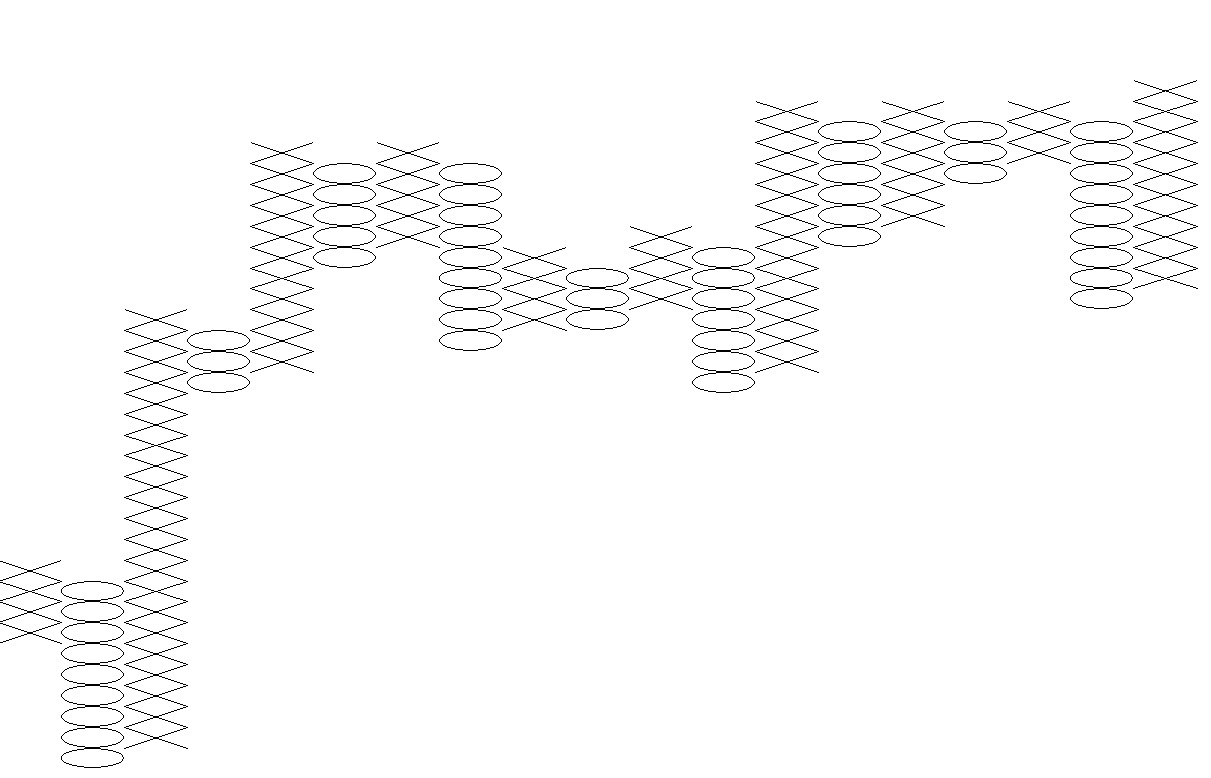
Afrimat (AFT) Horizontal Count with a Point and Figure Chart 2016 to 2019 - Chart by Metastock
The horizontal count allows us to calculate how far up the Afrimat share price will go now that it has broken out of its sideways market. Our calculations indicate that it will go as far as 4244c – which is a gain of 33% from current levels. Unfortunately, the technique does not allow us to determine how long it will take to reach that level. Horizontal counts are generally around 70% to 80% accurate, although they tend to be on the conservative side. So this might well be an opportunity to make a solid capital gain on a company which is in the throes of re-inventing itself. In the PDSnet Online Investment Course, there is a module on point & figure charting - click here.DISCLAIMER
All information and data contained within the PDSnet Articles is for informational purposes only. PDSnet makes no representations as to the accuracy, completeness, suitability, or validity, of any information, and shall not be liable for any errors, omissions, or any losses, injuries, or damages arising from its display or use. Information in the PDSnet Articles are based on the author’s opinion and experience and should not be considered professional financial investment advice. The ideas and strategies should never be used without first assessing your own personal and financial situation, or without consulting a financial professional. Thoughts and opinions will also change from time to time as more information is accumulated. PDSnet reserves the right to delete any comment or opinion for any reason.
Share this article:
