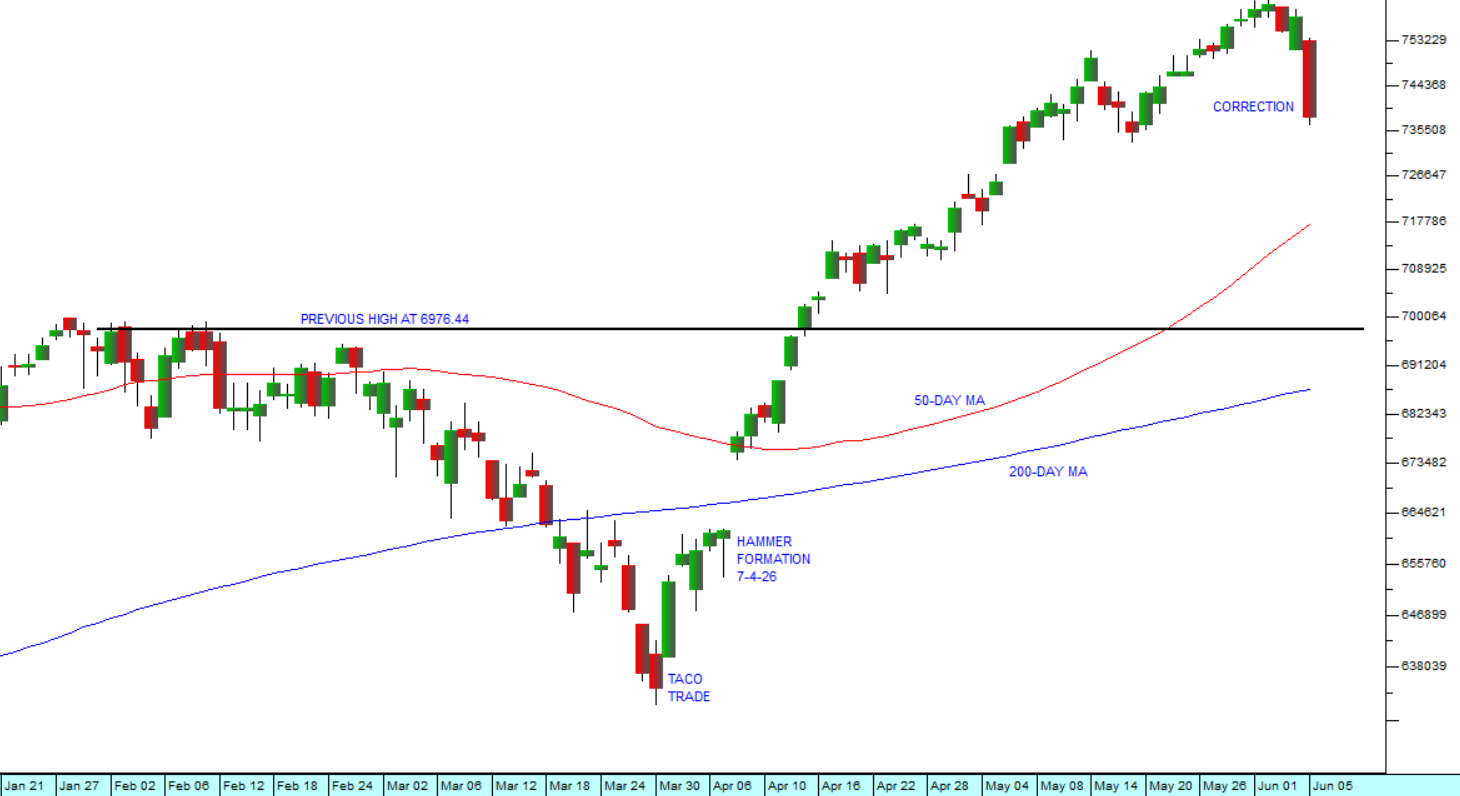
Experienced investors know that when a market has run hard for a while, as it has for the last two months, some sort of correction is more-or-less inevitable. We suggested in the recent Confidential Report that right now you should be looking for that correction – and then on Friday the 5th of June 2026, the S&P500, which was teetering after having made a new record high (7609.78) fell by an impressive 2,64%. Consider the chart:
 S&P500 Index : 21st of January 2026 - 5th of June 2026. Chart by ShareFriend Pro.
The anatomy of a correction is that the positive news in the market reaches a point where it has been heavily over-discounted and shares begin to look seriously vulnerable and over-priced. Profit taking then sets in and the market falls back to more reasonable levels. This is a natural and normal pattern - even healthy - which reflects the interaction of the two great human emotions which dominate the market – fear and greed.
The fundamentals of a share can indicate what profits are likely to flow from owning it, while the technicals show the thrust of investor sentiment towards or away from it. When it comes to analysis, there are two kinds of people in the market – those that say they will not buy a share unless they can see the “real” value (the fundamentalists) – and those who say that the real value does not matter. What matters is what people think the real value is (the technicians). In other words, the reality and the perception of that reality.
And markets, like wildfires, can sometimes create their own energy. They can reach a point where they get carried up or down by the mere fact of their own momentum. In the longer term, the positivism or bullishness which is driving this market up today is beginning to become a self-fulfilling prophecy. Some investors are now coming into the market, not because they have done their homework and can see the earning potential of the shares that they want to buy, but rather because they are confident that in a few weeks’ or months’ time, someone with even less knowledge than them will buy the same shares back from them at a higher price.
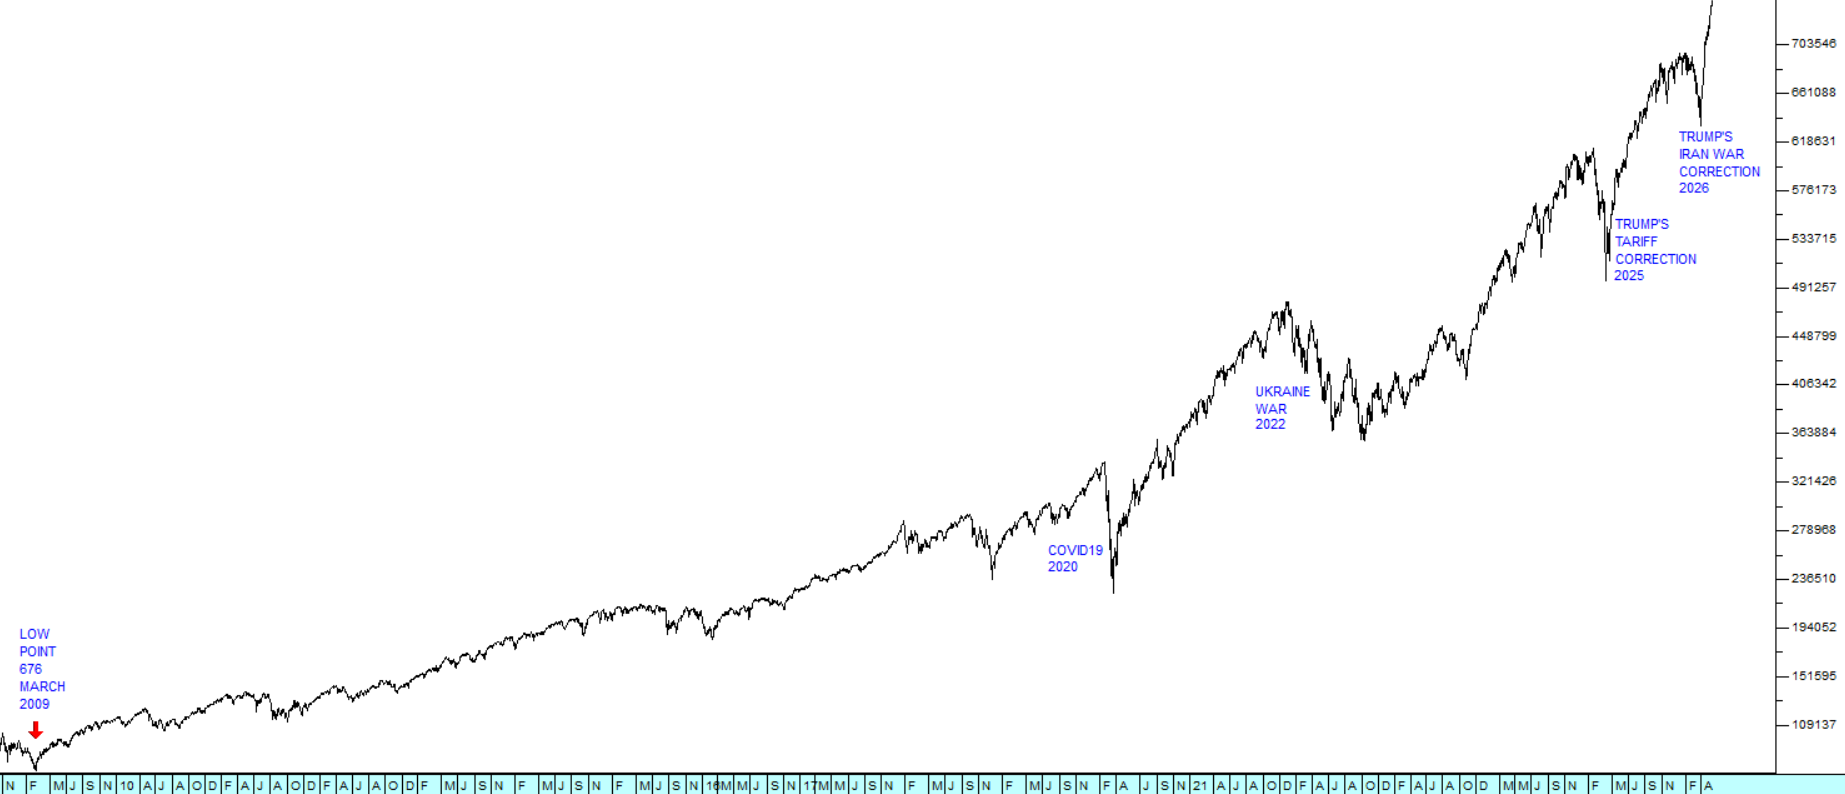
When this begin to happen, the share’s price tends to lose touch with its underlying fundamentals and become over-priced. The fundamentals may be very good – but the important question is, “Are they good enough to justify the current price?” In 1998, during the dot-com boom, the blue sky potential of the nascent internet boom seemed immense – just as the potential of AI seems immense to us today. But, markets went too far, bid shares up too high, and inevitably fell back to more reasonable levels. However that did not mean that the potential of the internet was suddenly gone – far from it. The internet’s potential was only just beginning to be understood. It was just that markets had become too excited and lost sight of their underlying fundamentals.
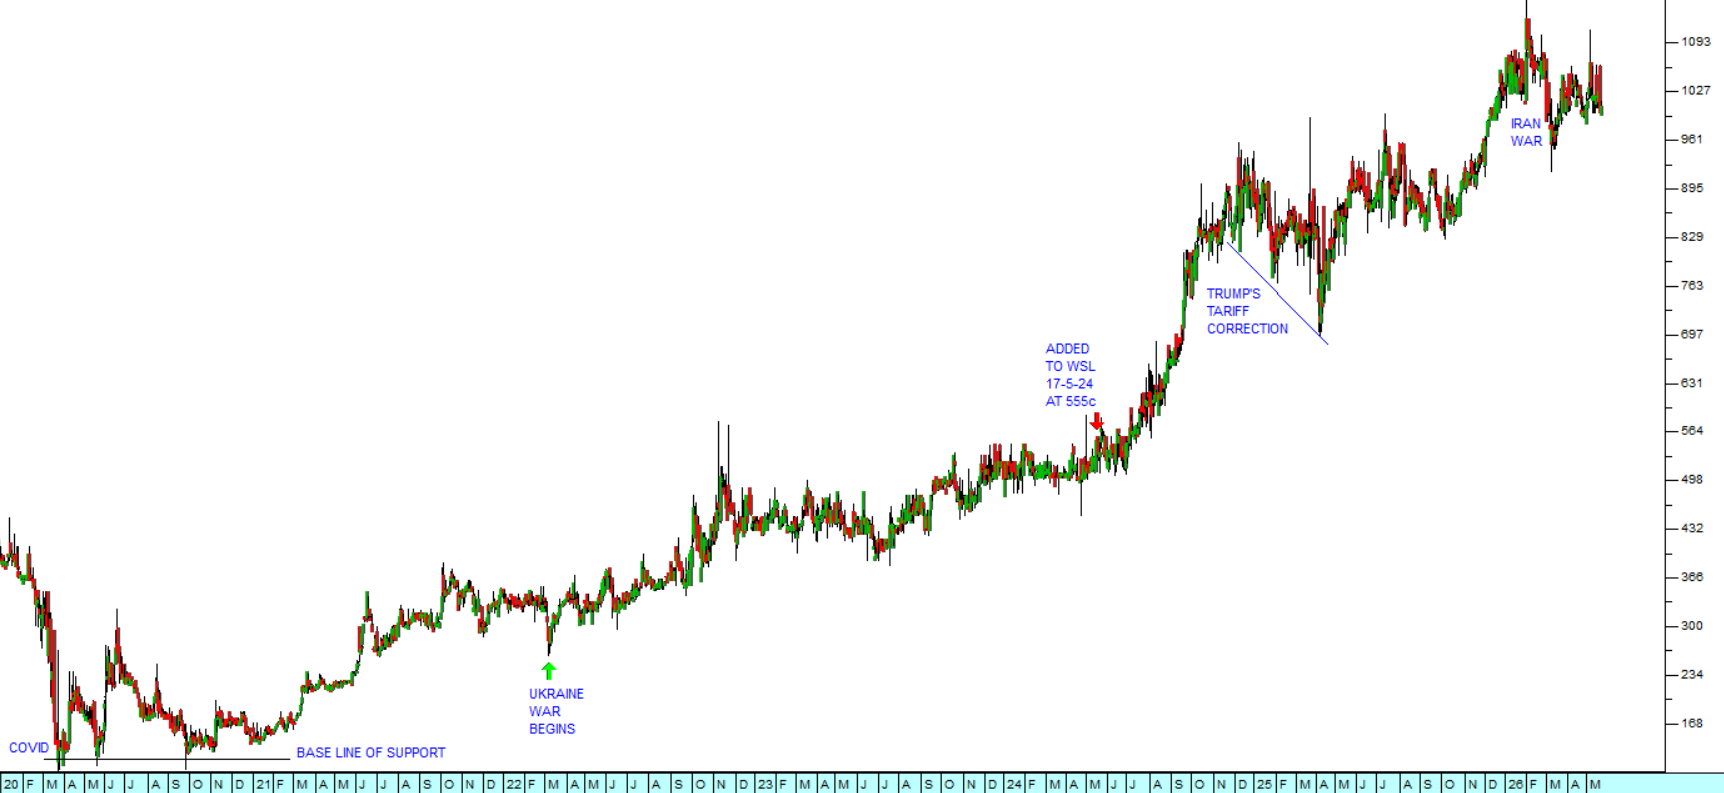
We pointed out in our article of 18 May 2026 that the S&P 500 chart is becoming exponential. The blue sky potential of shares is now the dominant factor in investors’ assessments, with the focus shifting to possible future profits rather than established track records. Investors are concentrating on forward, rather than historical, P:E ratios. It is sobering to realise that all three of the enormous new listings coming to Wall Street this year—SpaceX, OpenAI, and Anthropic—are still unprofitable..
In our view, the current correction on Wall Street, and hence on markets around the world including the JSE, is more than likely temporary. After a period of selling, the downward trend will almost certainly give way to bullish investors seeking to buy the dip. Since there is no obvious fundamental factor driving this downward trend we see it as almost completely technical – and therefore temporary and healthy. The market is literally catching its breath.
What is interesting is that the JSE Overall index made its record high on 27th February 2026, at 128456, and has been basically trending down since then. It is apparent that local investors never really believed much in Wall Street’s strong recovery from Trump’s Iran war correction. We have found that often the JSE is a leading indicator of what happens on Wall Street.