Property shares do not generally make very exciting investments – but they make up for that by being very secure. Their security lies in the fact that their net asset value (NAV) is mostly comprised of very conservatively valued properties. Other companies often have insubstantial assets in their NAV like goodwill, intellectual property and other intangibles.
The property market is recovering from the impact of COVID-19 which saw many good quality property companies trading at a fraction of their NAV. The big institutional investors who make up 90% of the JSE really like secure investments. They were shaken out of property shares by COVID-19, but they are gradually regaining their appetite for them.
One of the best examples of an institutional share that lost favour in 2020 is Hyprop which reached a low point of 1467c on 24th April 2020 – less than 20% of its NAV at the time. By anyone’s measure at that price it was a raging bargain.
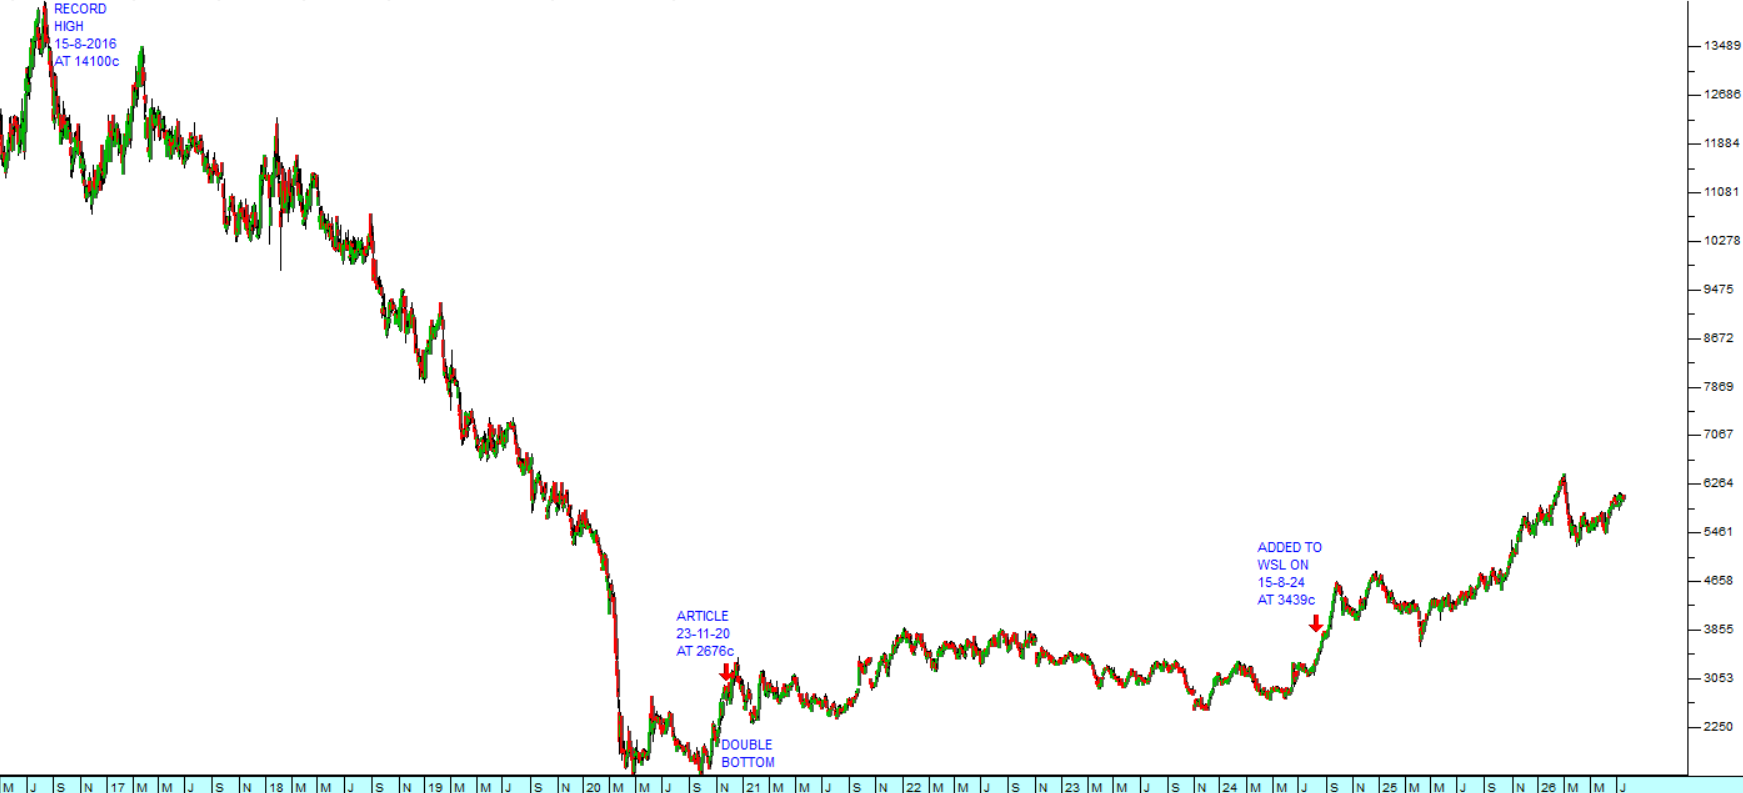
Back then we were not yet producing the Winning Shares List (WSL) but we wrote an article about Hyprop which we published on 23rd November 2020 after the share completed a double bottom or island formation and it began to appreciate. Consider the chart:
 Hyprop Investments Ltd (HYP) : March 2016 - 17th of July 2026. Chart by ShareFriend Pro.
The double bottom formation is a very solid and visible indication that a long downward trend is almost certainly over. At the time we recognised that Hyprop had broken up out of its island and was beginning to appreciate.
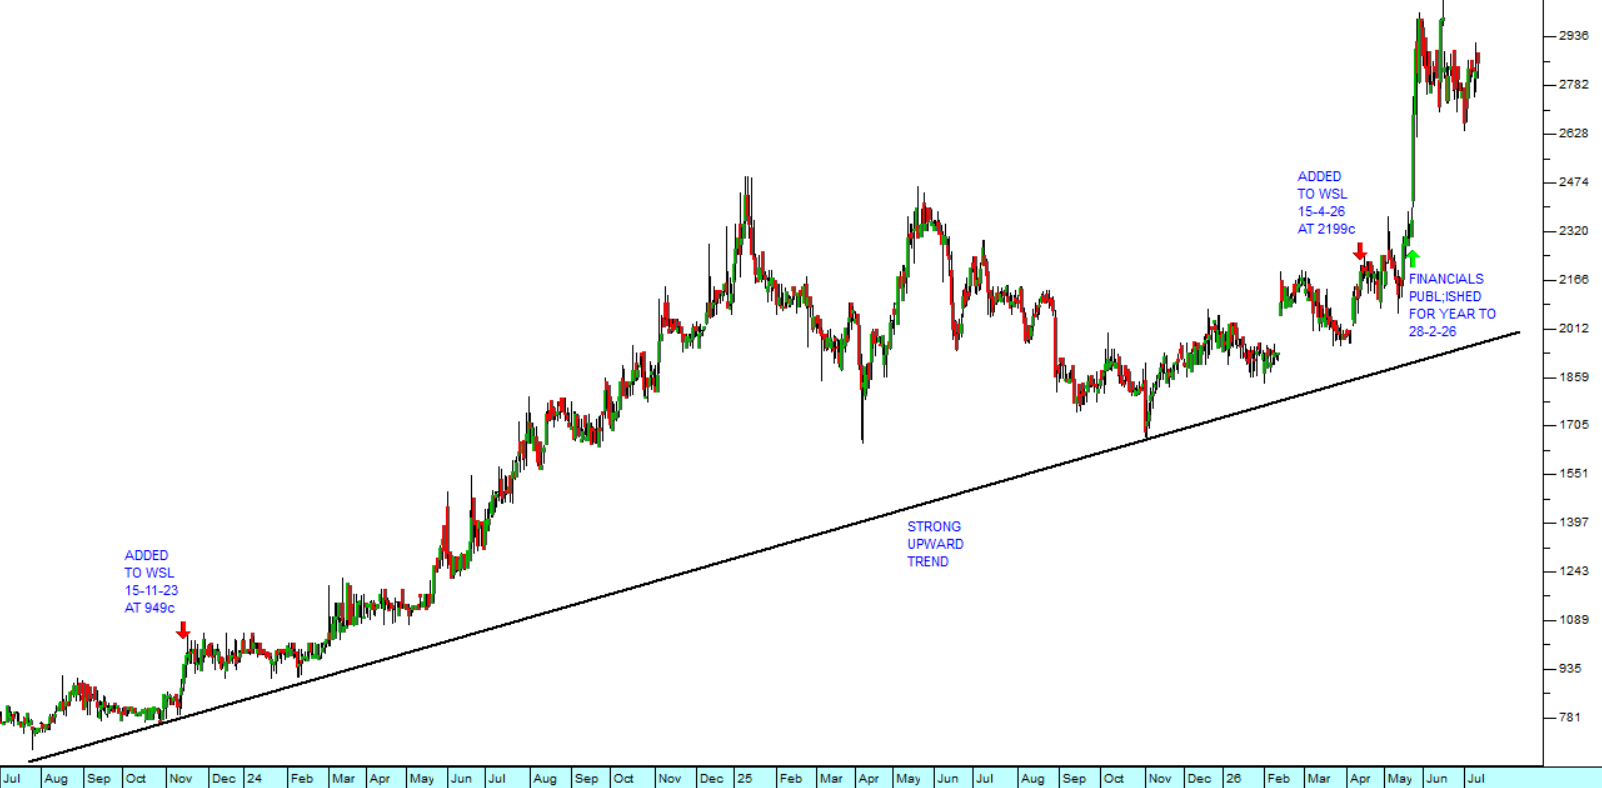
It took another two years before the institutional investors finally recognised its value and began buying it up in earnest. It began to recover and then we added it to the WSL on 15th August 2024 at 3439c. Since then, it has been appreciating steadily.
You will note that at its peak, back in August 2016, Hyprop reached a record high of 14100c – at which time it was trading almost 50% above its NAV of the time. On Friday last week it closed at 6052c – which was just below its NAV of 6443c. So, we see it as having some considerable further upside potential given the gradual improvement in the South African economy.
When thinking about this company you cannot help being impressed by the high quality of the assets which it owns. These include Canal Walk in the Western Cape, Somerset Mall, Hyde Park Corner, Rosebank Mall, and Clearwater Mall. These assets are almost always close to fully let (3,1% vacancies on average) and patronised by high-end A/B income group shoppers. At year-end on 31st December 2025 the company had a loan-to-value of just 31% - which means that it has plenty of headroom for further acquisitions.
In a pre-close operational update for the five months to 31st May 2026 the company reported a 4,5% improvement in collections and a 5,5% improvement in tenants’ turnover. The company said, “Demand for space remains exceptionally high, with a 0% vacancy rate in May 2026.”
We have no hesitation in recommending this share for your investigation, especially if you are looking for a more conservative long-term investment with a low risk profile.