US Economic Boom
12 March 2018 By PDSNETThe current correction on Wall Street has two primary causes:
- The rise in the level of wages last month which made investors scared of a much more hawkish stance by the US Federal Reserve Bank’s Monetary Policy Committee (MPC), and
- The fact that the market had just run too hard for too long and some sort of a breathing space was both necessary and healthy.
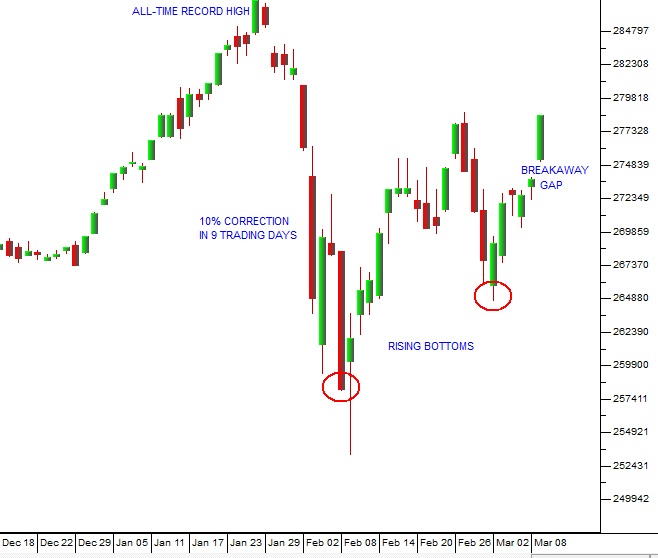
S&P500 Index December 2017 to March 2018 - Chart by ShareFriend Pro
The S&P500 retraced 10% in just nine trading days. We always thought that was too quick. After all, the previous correction at the end of 2015 and the beginning of 2016 took nearly 7 months to fall by 14%. In addition to that, the US economy was booming – and the stock market always has to reflect what is happening in the economy sooner or later. For those reasons we expected that this correction would be short and sharp rather than protracted. We wrote an article about this correction on 9-2-18 where we said, “We believe that it will be short and sharp” – and that you should treat it as a buying opportunity. And we always expected that the positive news coming out of the US economy would be the trigger that ended this correction. In that same article we said, “we think that, as the positive economic statistics come through, they will shift the sentiment on Wall Street back to positive”. And that is exactly what has happened. The jobs report which came out on Friday (9-3-18) showed that the US economy created a massive 313 000 new jobs in February month – more than 50% above what economists were expecting (200 000). At the same time, the average wage rose by less than expected – calming fears that the MPC would rush to raise interest rates. It was the perfect combination for the stock market and by close the S&P was up 1,74% at 2786,57 – just 3% off its all-time record high (2872,87). You can see early bullish signs in the chart. For example, we now see rising bottoms – always a good sign. And then on Friday we had a “break away gap” where the S&P opened higher than the previous day’s close – creating a gap. Technically this shows that there is strong bullish sentiment. Of course, this does not necessarily mean that the correction is over. But it now seems less and less likely that it will fall further and more and more likely that a new record high will be made within the next few weeks.DISCLAIMER
All information and data contained within the PDSnet Articles is for informational purposes only. PDSnet makes no representations as to the accuracy, completeness, suitability, or validity, of any information, and shall not be liable for any errors, omissions, or any losses, injuries, or damages arising from its display or use. Information in the PDSnet Articles are based on the author’s opinion and experience and should not be considered professional financial investment advice. The ideas and strategies should never be used without first assessing your own personal and financial situation, or without consulting a financial professional. Thoughts and opinions will also change from time to time as more information is accumulated. PDSnet reserves the right to delete any comment or opinion for any reason.
Share this article:
