The S&P and Dischem
28 August 2017 By PDSNETThe past week has been interesting from a market point of view. Consider the chart of the S&P500:
S&P500 Index August 2017 - Chart by ShareFriend Pro
The S&P500 [glossary_exclude]index[/glossary_exclude] fell heavily on Thursday the 10th and then staged a recovery of sorts before falling even more heavily a week later on the 17th and then mounting a second recovery. Clearly, there is significant bullish sentiment still in the market – enough to make these recoveries possible. But the observant technician will note that the correction, which began on the 8th of August, and which we discussed in a previous article two weeks ago, is still in place. What is evident is that there is a considerable degree of uncertainty and hence volatility in the market. Obviously, the key level now is 2410 – the previous low. Any fall below this will signal that this is a significant correction. At the same time, a rise to a new record high or even [glossary_exclude]close[/glossary_exclude] to a new record high will indicate that the correction is over and the underlying bull trend is resuming. Of course, as indicated earlier, it is our opinion that the underlying [glossary_exclude]bull[/glossary_exclude] [glossary_exclude]trend[/glossary_exclude] is solid and will resume sooner or later. The question is exactly when. In other words, just how [glossary_exclude]long[/glossary_exclude] will this correction last and how deep will it be. Right now, it’s low is less than 3% below the all-time record high – so it might still progress somewhat further.CUP AND HANDLE FORMATION
Some months ago, shortly after its listing, we recommended that you should invest in some Dischem [glossary_exclude]shares[/glossary_exclude]. The shares have performed very well as Dischem fulfilled its potential to have a Dischem store wherever there was a Clicks. Recently, however, Dischem shares have gone through a cup-and-handle (sometimes called “cup-and-lip”) [glossary_exclude]formation[/glossary_exclude]. This formation was first identified by Willaim o’Niell of The [glossary_exclude]Investors[/glossary_exclude]’ Daily in America. It is a strongly bullish formation which occurs during an existing [glossary_exclude]bull[/glossary_exclude] [glossary_exclude]trend[/glossary_exclude]. Consider the chart:
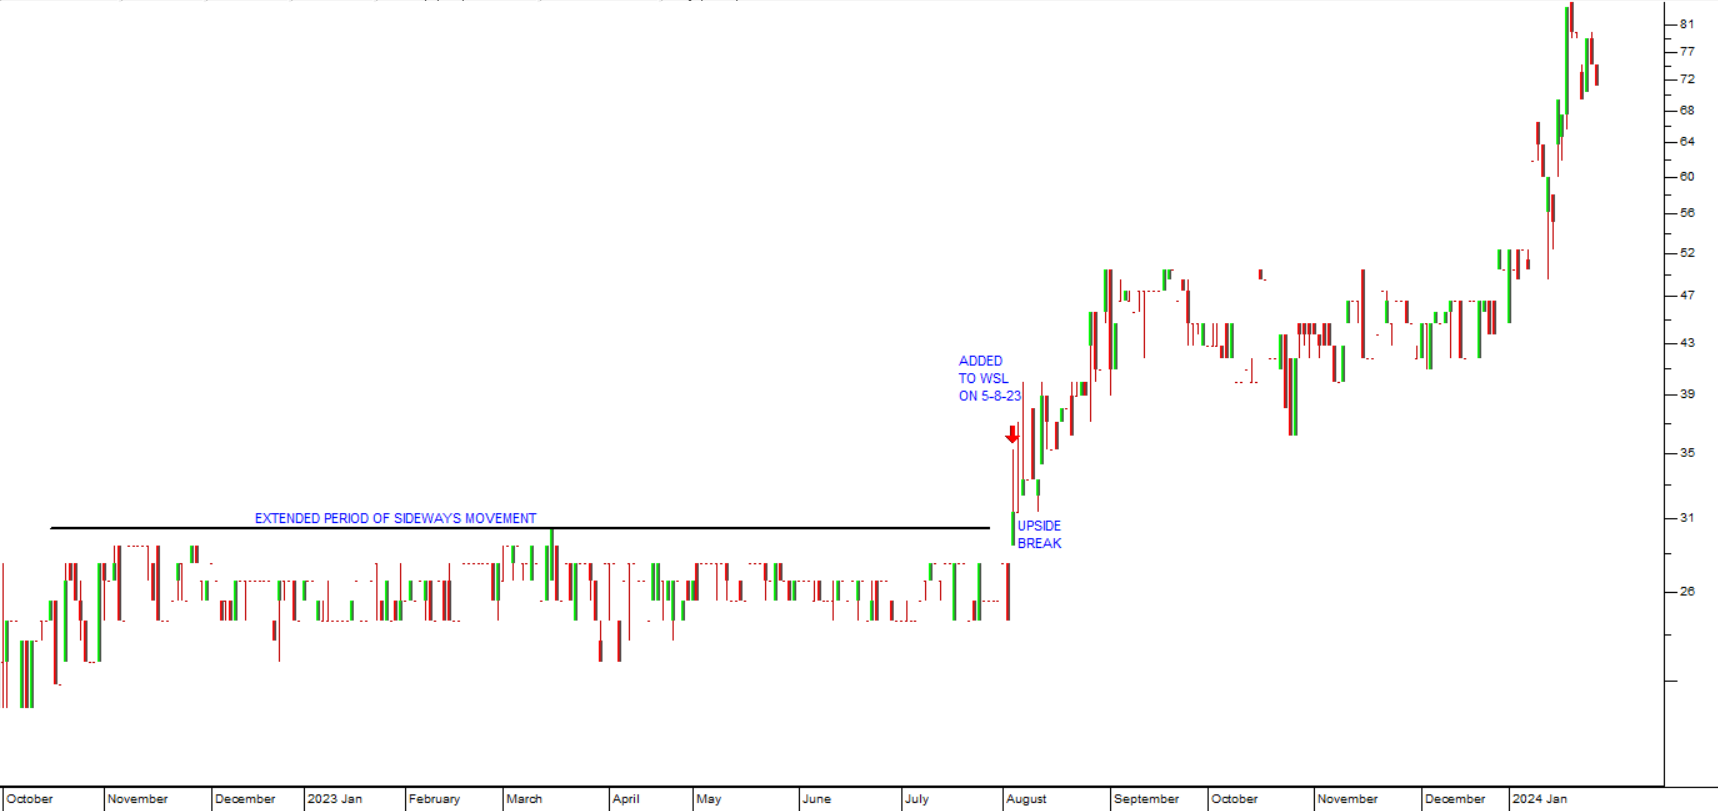
Dischem (DCP) - Chart by ShareFriend Pro
You can see here that Dischem is in a well-established [glossary_exclude]bull[/glossary_exclude] [glossary_exclude]trend[/glossary_exclude] and then the “cup” formation occurs, immediately followed by the “handle” or “lip”. Once the share breaks above the previous high point in the “lip” it should move up strongly – and this is exactly what Dischem did on Friday. It is rare to find a predictive technical formation so early in the listing of a new share, but in this case we feel optimistic that Dischem should move up further following this formation.DISCLAIMER
All information and data contained within the PDSnet Articles is for informational purposes only. PDSnet makes no representations as to the accuracy, completeness, suitability, or validity, of any information, and shall not be liable for any errors, omissions, or any losses, injuries, or damages arising from its display or use. Information in the PDSnet Articles are based on the author’s opinion and experience and should not be considered professional financial investment advice. The ideas and strategies should never be used without first assessing your own personal and financial situation, or without consulting a financial professional. Thoughts and opinions will also change from time to time as more information is accumulated. PDSnet reserves the right to delete any comment or opinion for any reason.
Share this article: