The JSE and the Rand
25 June 2018 By PDSNETThe following two charts show the rand and the JSE Overall index over the same period – from 24th June 2013 up to today. The relationship between them is instructive.
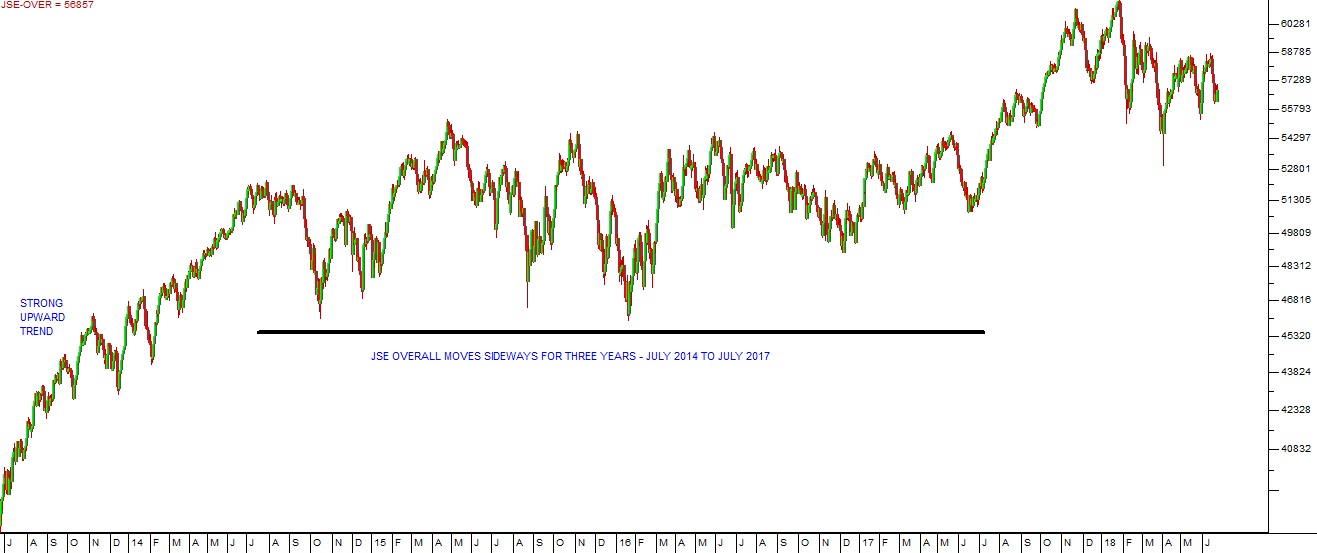
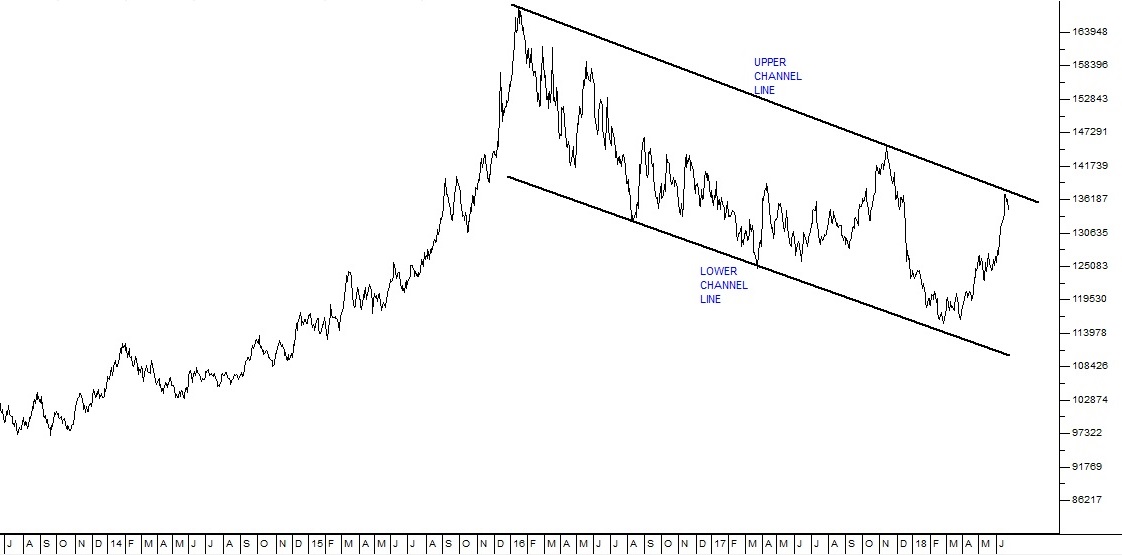
JSE Overall Index July 2013 to June 2018 - Chart by ShareFriend Pro
Rand Dollar Exchange July 2013 to June 2018 - Chart by ShareFriend Pro
The JSE Overall index (J203) has always discounted the volatility of the rand because so many of our shares have a rand-hedge component. In other words, many of our largest companies receive a substantial portion of their revenue and profits off-shore in a hard currency – so when the rand weakens they do better and vice versa. In addition to this, like any emerging market, our stock market and currency reflect overseas perceptions of the political risk in this country. Funds flow into and out of our bond and stock markets as things improve or get worse. About four years ago in the middle of 2014 (at the extreme left of the two charts above), the index was in a strong upward trend – which reflected the bull market in Wall Street and other world markets. This bull trend was caused by smart investors anticipating the economic recovery and upswing which is currently in progress in America and other first world countries. At the same time, we were well into the Zuma era and the rand was trading at around R10.10 to the US dollar, but weakening at the steady rate of approximately 1c per trading day on average. At that point, the upward trend in JSE Overall index just stopped. Then it remained in a sideways market for the next three years. From that point, the massive 60% decline in the rand to its cycle low at R16.84 to the dollar in mid-January 2016 was off-set by the worsening political situation until Nene was fired as Minister of Finance. International perceptions of corruption, the Guptas and state capture were at their worst. The economy was grinding down from growth rates well above 3% towards zero and even below. The appointment of Pravin Gordhan as Minister of Finance signaled a new strengthening trend in the rand. It was the first concrete sign that the Zuma era was coming to an end. Later in mid-2017 the JSE overall index responded to this and ultimately broke out of its sideways market. Once Ramaphosa was appointed, the rand gained even more ground, reaching a high of R11.50 to the US dollar in February 2018. This caused new calamities as the mining companies already hammered by low commodity prices were squeezed even further by the stronger rand. Combined with this, 2018 saw a swing to “risk-off” among international investors – which basically means that they began pulling their money out of emerging markets and returning it to safe havens – like US treasury Bills. The rand has weakened with other emerging market currencies – but is generally the best of those. This trend has driven the rand back to its upper channel line at around $13.70 to the dollar and saved the mining industry to some extent – but it now seems that the international risk cycle is going to swing back to “risk-on”, causing the rand and the stock market to strengthen again as we move towards our election date in mid-2019.DISCLAIMER
All information and data contained within the PDSnet Articles is for informational purposes only. PDSnet makes no representations as to the accuracy, completeness, suitability, or validity, of any information, and shall not be liable for any errors, omissions, or any losses, injuries, or damages arising from its display or use. Information in the PDSnet Articles are based on the author’s opinion and experience and should not be considered professional financial investment advice. The ideas and strategies should never be used without first assessing your own personal and financial situation, or without consulting a financial professional. Thoughts and opinions will also change from time to time as more information is accumulated. PDSnet reserves the right to delete any comment or opinion for any reason.
Share this article: