The Exponential Bull
22 March 2017 By PDSNETA little while ago (Upside Target 4-12-16), we drew attention to the fact that the S&P500 index had an amazing forward horizontal count (using the Point & Figure charting method) - based on it breaking upwards out of its lengthy sideways market. Without giving a time frame, this horizontal count projected that the S&P would reach 3027, a 38% rise from where it was then at about 2212. So far, since then, it has climbed about 7,5% to 2378.
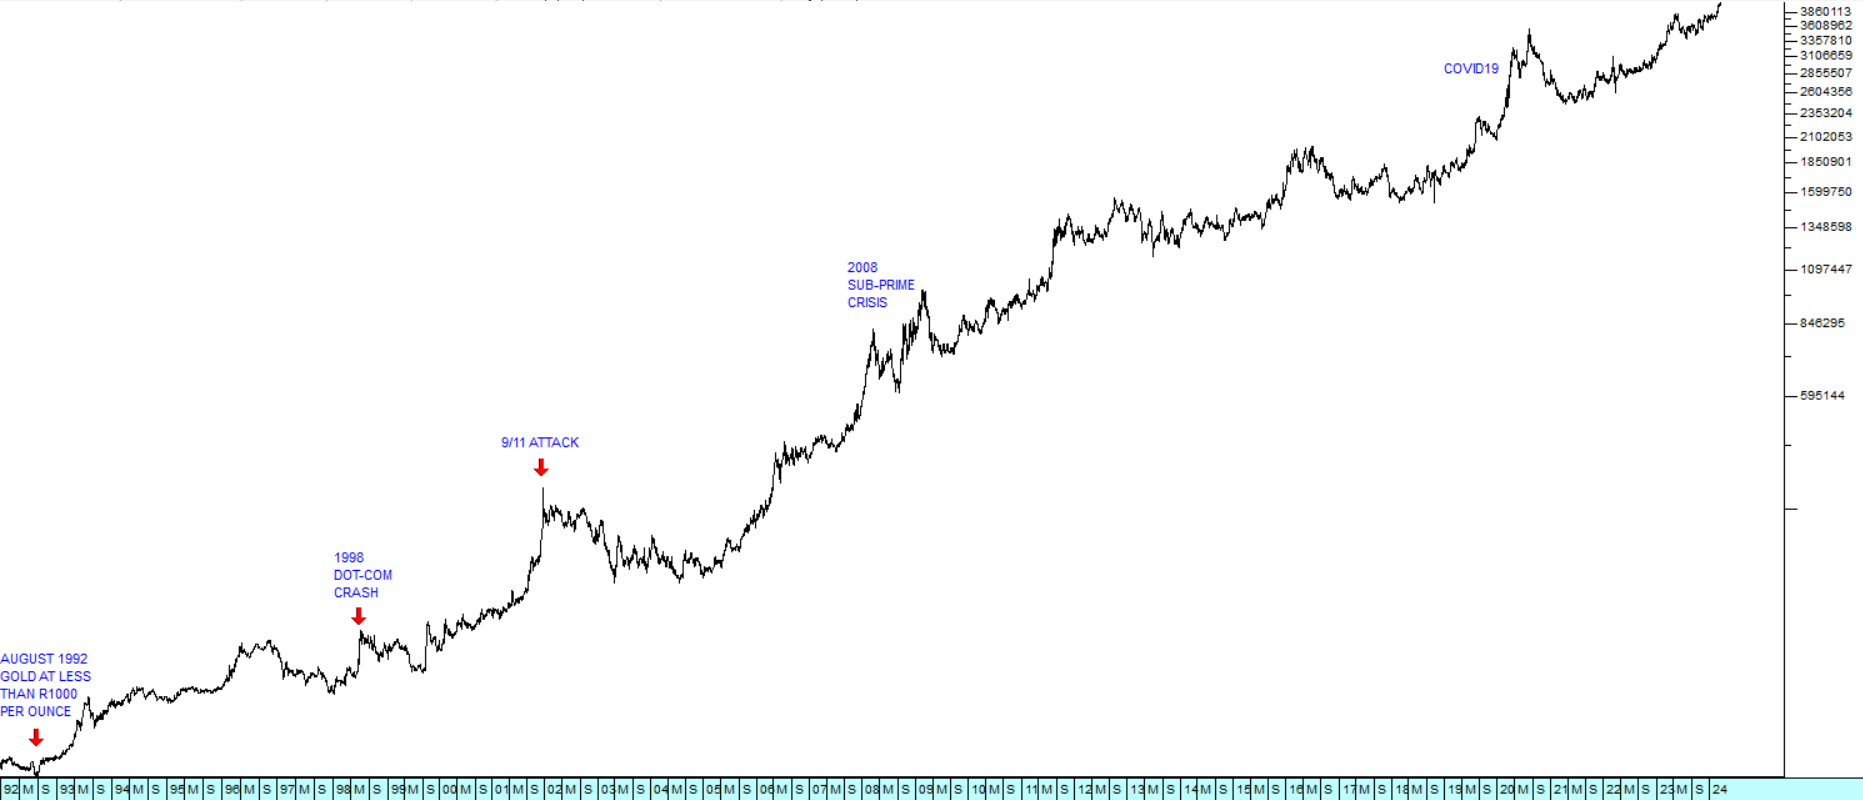
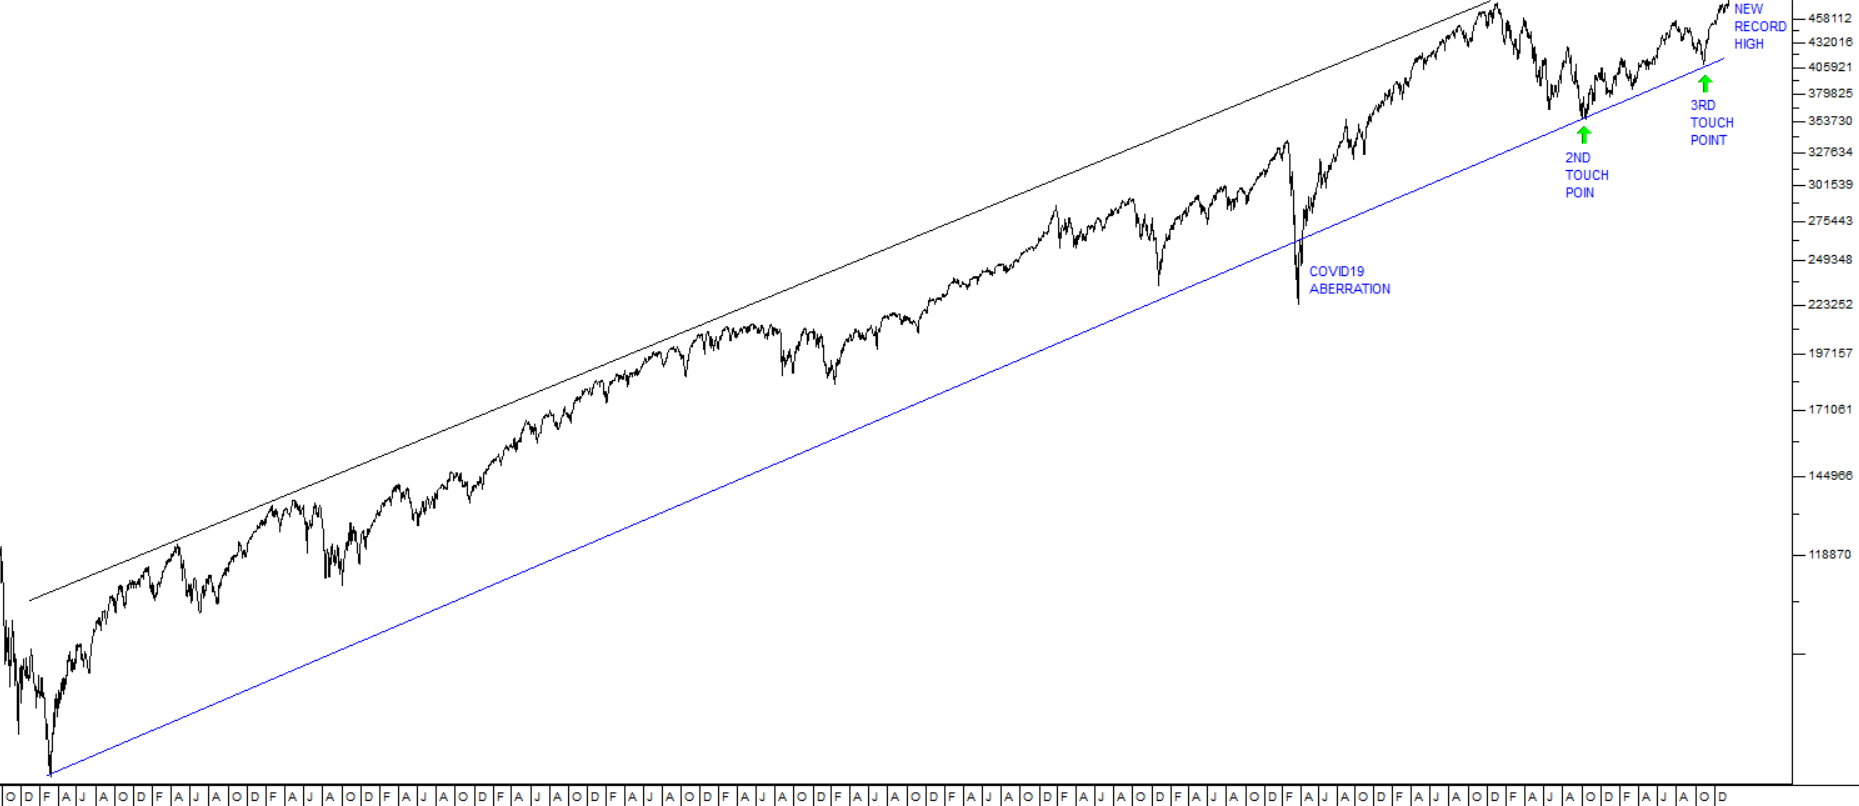
From a fundamental perspective, this is hardly surprising, given the unprecedented monetary stimulation of the US and world economies over the past ten years. What is interesting, however, is the shift in the rate at which the S&P has been climbing. Consider the bull market since 2009: 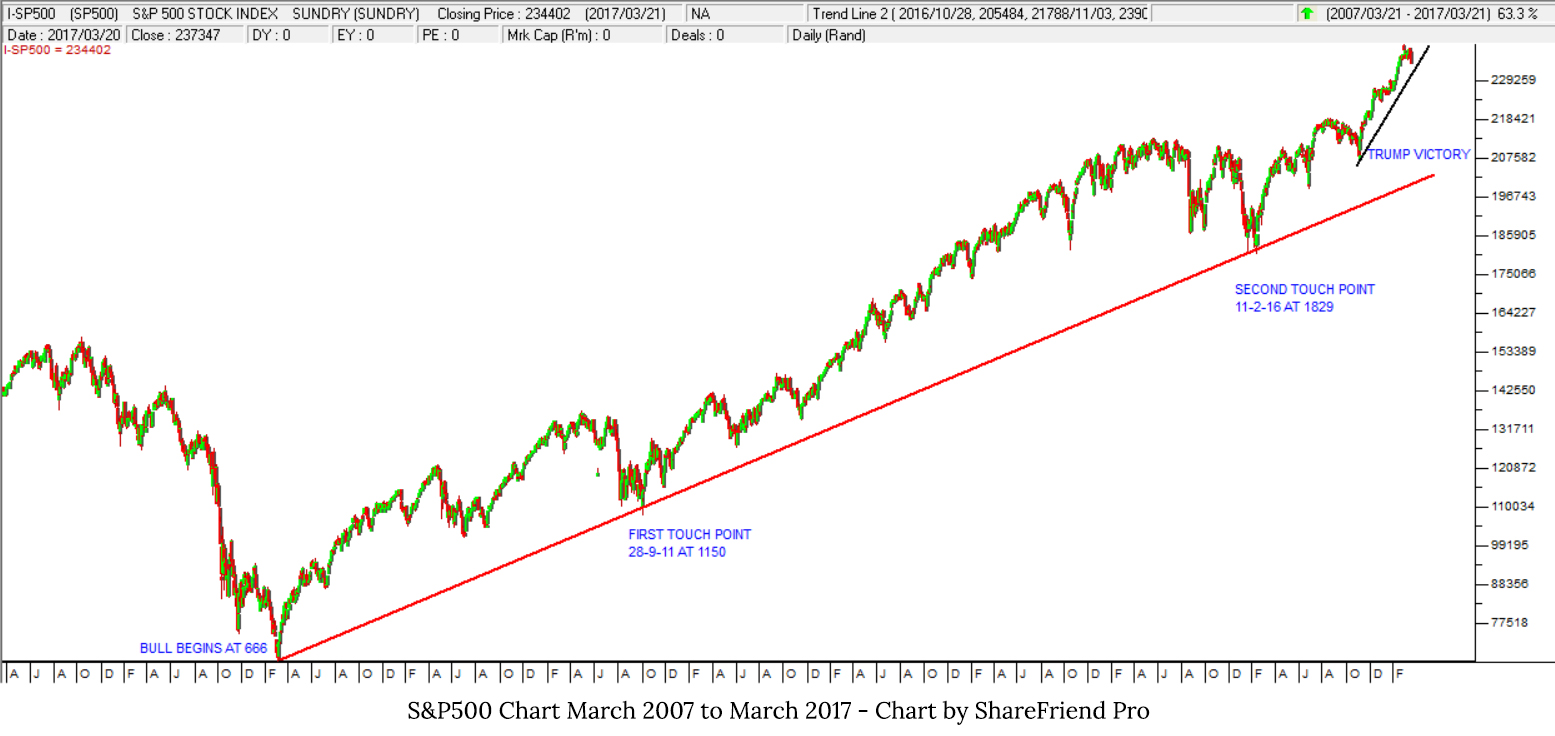 Until Donald Trump's election, the bull trend had been proceeding very slowly, impeded and made hesitant by the fear that lingered from the 2008 sub-prime crisis. There were times in 2011 and 2016 (the two touch points), when the economic experiment of massive international quantitative easing teetered on the edge of disaster. Another great depression seemed to be beckoning - and many investors ran for cover. But slowly, like an exhausted animal dragging itself from the primeval mud, the US economy has begun to show real signs of strong recovery. The latest employment figures indicate that this $20 trillion behemoth is lumbering back into action. Reacting to that, the S&P has entered a new period of much faster growth. This can be seen by the much steeper angle of the second, shorter trendline on the chart above. The acceleration is certainly not Trump's doing, at best, he can only claim to be the trigger, but it will certainly have the impact of pushing world markets up, the JSE included. Great bull markets are typically exponential. They begin slowly, almost unnoticeably and then gradually gain momentum as belief gathers and cynicism fades. Eventually, like all exponentials, they become unstoppable, even insane. And it seems to us that what we may be looking at right now is the turning point in an exponential chart where it shifts from moving mainly horizontally to moving mainly vertically. We repeat our earlier prediction that we are well into what will probably be this century's longest and strongest bull trend. You should be close to fully invested to take advantage without ever losing sight of your stop-loss levels.
DISCLAIMER
All information and data contained within the PDSnet Articles is for informational purposes only. PDSnet makes no representations as to the accuracy, completeness, suitability, or validity, of any information, and shall not be liable for any errors, omissions, or any losses, injuries, or damages arising from its display or use. Information in the PDSnet Articles are based on the author’s opinion and experience and should not be considered professional financial investment advice. The ideas and strategies should never be used without first assessing your own personal and financial situation, or without consulting a financial professional. Thoughts and opinions will also change from time to time as more information is accumulated. PDSnet reserves the right to delete any comment or opinion for any reason.
Share this article: