S&P500 Earnings
31 October 2018 By PDSNETWhether we like it or not, the progress of the JSE is determined to a considerable extent by what happens on Wall Street. If the New York Stock Exchange (NYSE) is in a bear trend then the high probability is that the JSE will also be heading south. So, private investors are always well-advised to keep their eye on American markets and to take a view on where they might be going.
The best way to follow the NYSE is through the S&P500 index. This is a weighted index of the 500 largest companies trading on Wall Street. The 500 companies which it includes are constantly the subject of intense analysis and prediction. American companies report every three months – so the quarterly updates are eagerly awaited and anticipated.
The third quarter ended on 30th September 2018 and so far 140 of the 500 companies have reported their results. Of those companies, over 80% have beaten analysts’ expectations. Strong economic growth, coupled with Mr. Trump’s tax relief, has produced an excellent quarter. The quarter is expected to see profits up by 22,5% off a 7,5% improvement in turnover. You can view the progress of the S&P500 companies’ results here: https://lipperalpha.financial.thomsonreuters.com/img/uploads/2018/10/SP500_18Q3_DashBoard_181017.png
So then, you might ask, why is the S&P500 index falling? The answer to this question is complex and multi-faceted. Firstly, there is some concern over the international trade war which Mr. Turmp seems to be engendering. Secondly, there is concern that the strong performance of the economy will cause the Federal Reserve Bank (the Fed) to raise interest rates more aggressively. This is a common paradox on Wall Street where good economic results often cause the market to sell-off because of a fear of interest rate hikes. Usually, sooner or later, the continued good economic news outweighs the fear, and the market resumes its upward trend. And that is exactly what we expect to happen here.
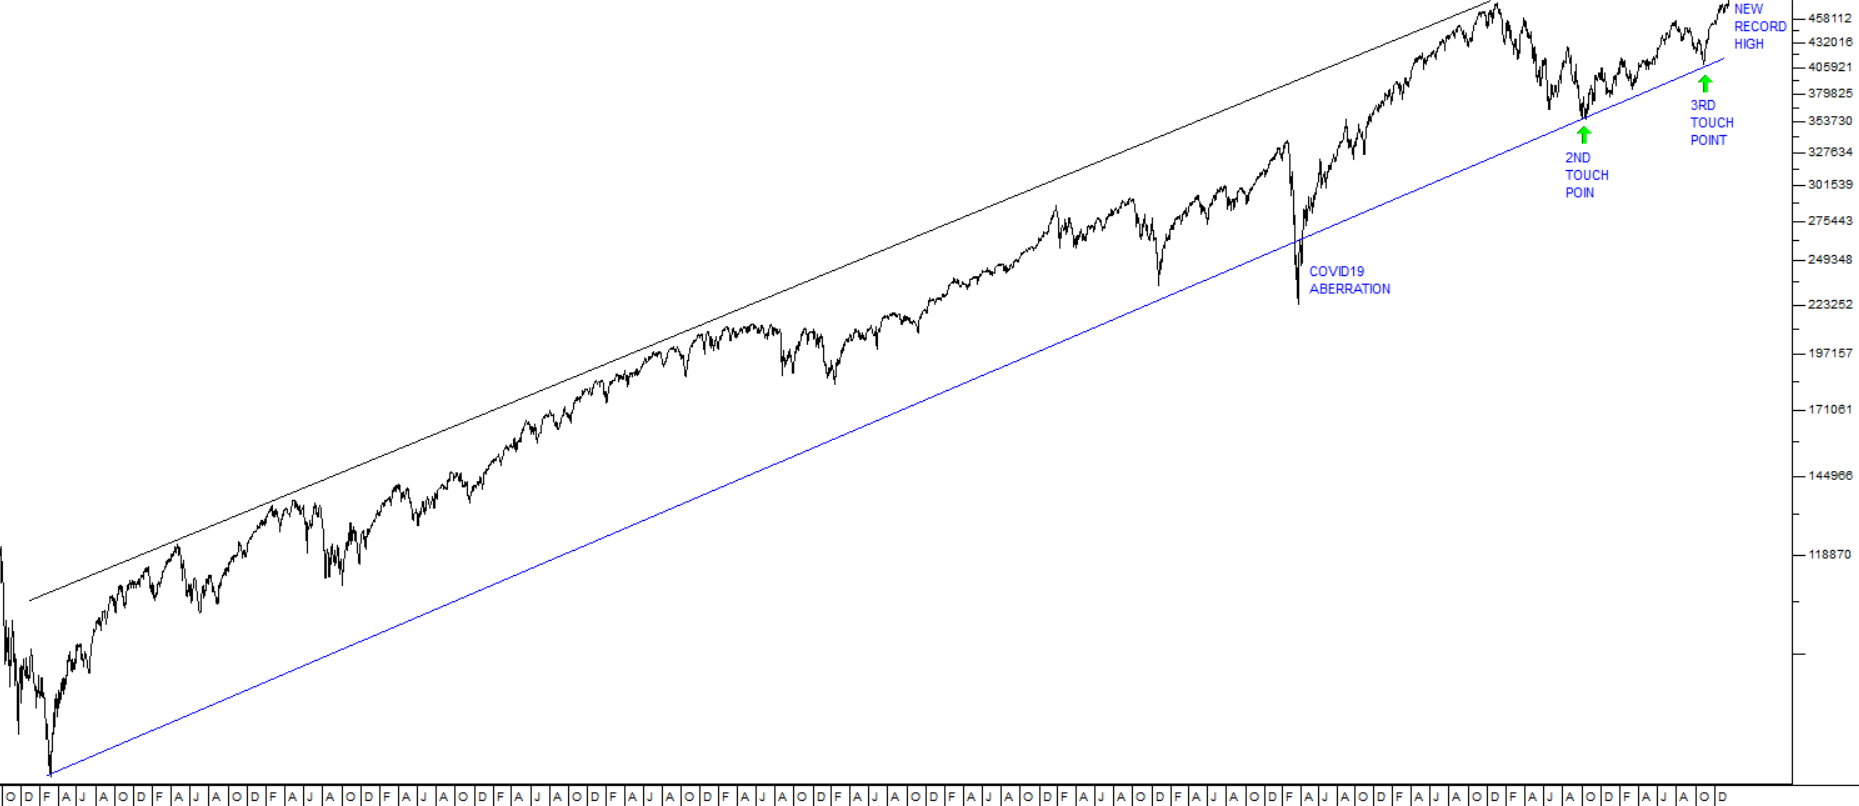
The S&P500 is now down close to 10% from its all-time record high of 2930 made on 20th September 2018. This is not exceptional in the context of the long-term bull trend which began in March 2009. Consider the semi-log chart of that bull trend:
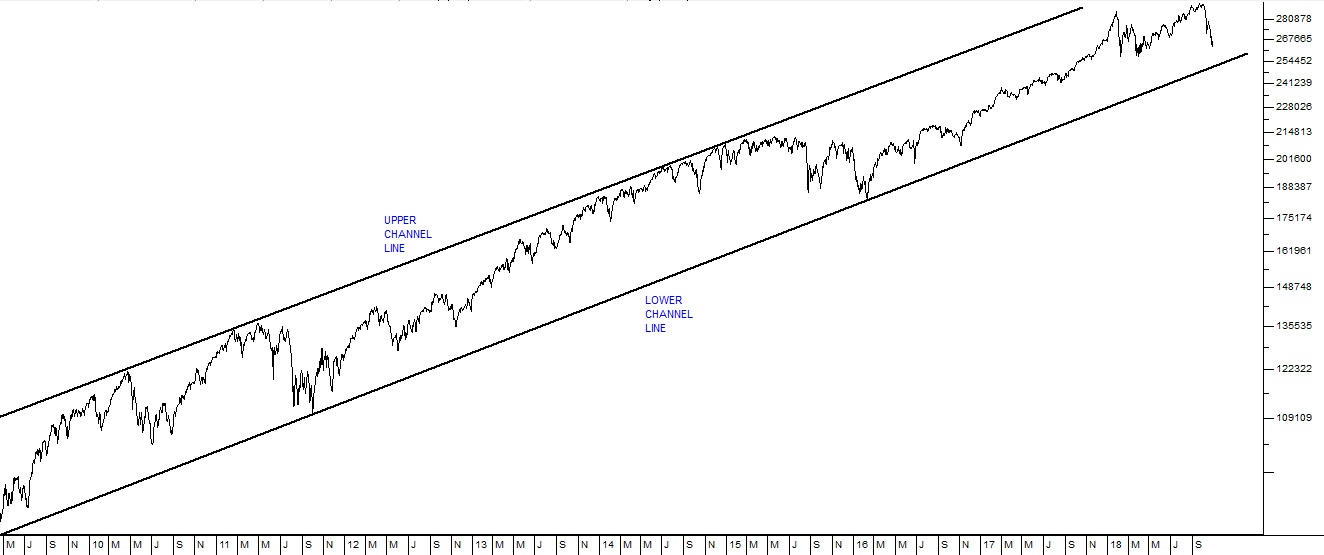
S&P500 Index Semi-Log Chart 2009 to 2018 - Chart by ShareFriend Pro
You can see here that the S&P has been moving within clearly defined channel lines. The current correction does not yet come close to the long term channel within which the S&P has been rising over the last nine-and-a-half years – and until it does we see no reason for undue concern. That level would be at about 2520. Looking at the technical perspective, over the last year, you can see that the index is coming close to a critical short-term support level at 2581.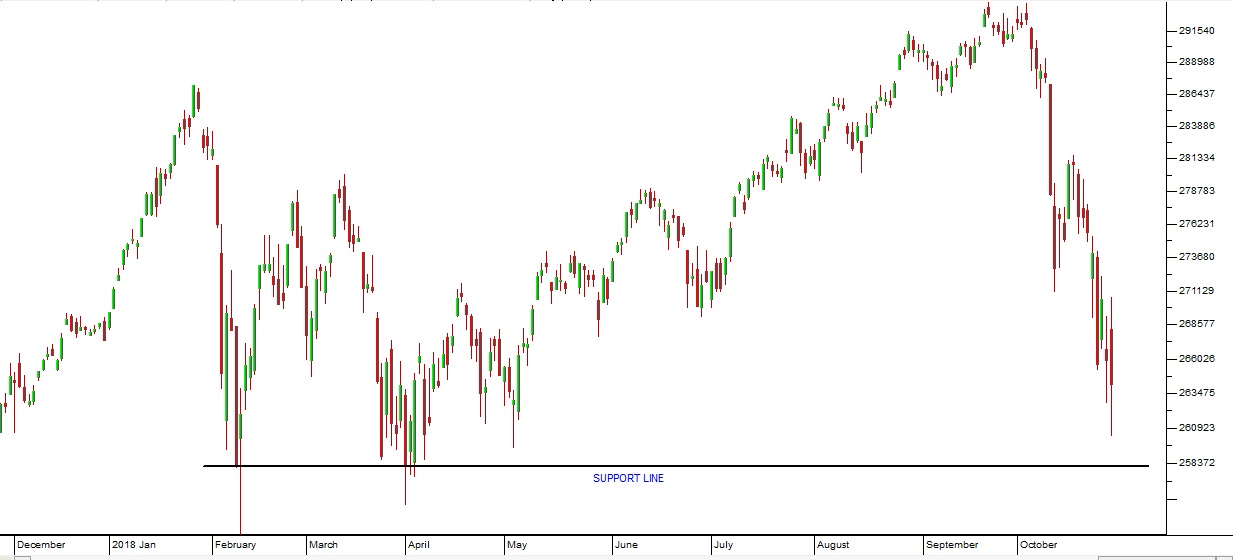 S&P500 Index December 2017 to October 2018 - Chart by ShareFriend Pro
If this level is broken then the correction continues. But we think that this is unlikely. We believe that the S&P will turn and begin to climb again – reflecting the constant stream of good news coming out of S&P company results.
S&P500 Index December 2017 to October 2018 - Chart by ShareFriend Pro
If this level is broken then the correction continues. But we think that this is unlikely. We believe that the S&P will turn and begin to climb again – reflecting the constant stream of good news coming out of S&P company results.
DISCLAIMER
All information and data contained within the PDSnet Articles is for informational purposes only. PDSnet makes no representations as to the accuracy, completeness, suitability, or validity, of any information, and shall not be liable for any errors, omissions, or any losses, injuries, or damages arising from its display or use. Information in the PDSnet Articles are based on the author’s opinion and experience and should not be considered professional financial investment advice. The ideas and strategies should never be used without first assessing your own personal and financial situation, or without consulting a financial professional. Thoughts and opinions will also change from time to time as more information is accumulated. PDSnet reserves the right to delete any comment or opinion for any reason.
Share this article:


