MSCI Emerging Markets Index
6 July 2018 By PDSNETTogether with about 22 other countries around the world, South Africa is regarded internationally as an �emerging market�. This means that investments in this country are seen as more risky than those in first world countries. That, in turn, means that we have to offer and pay a higher return to attract those investments.
Our bench-mark government bond (the R186) is currently offering a return of close to 9% per annum. The equivalent bond (T-Bill) in America is offering about 3%. This means that investors have put a value on the risk in this country of about 6% per annum.�
That risk is mostly political � or at least political in origin. The state capture, corruption, nepotism and incompetence that characterises our state owned enterprises (SOE) and government departments cost us dearly when borrowing money from overseas investors. The ratings agencies (Moodys, Fitch and Standard and Poors) evaluate that risk and give us a rating.
And the international investment community is not always willing to invest here � even at the higher returns offered by emerging economies like South Africa. Sometimes they are �risk-off� which means that they withdraw from the riskier investments in emerging markets and put their money into relatively risk free investments like US treasuries. What causes them to do that is something like Donald Trump�s recent trade war with the rest of the world.
As a private investor it is interesting to compare our performance with that of other emerging markets and this can best be done by looking at the [cm_tooltip_parse]MSCI emerging markets index[/cm_tooltip_parse]� (MSCI) which gives an average of the 23 emerging markets leading indexes. Consider the chart of the MSCI over the past 9 years:
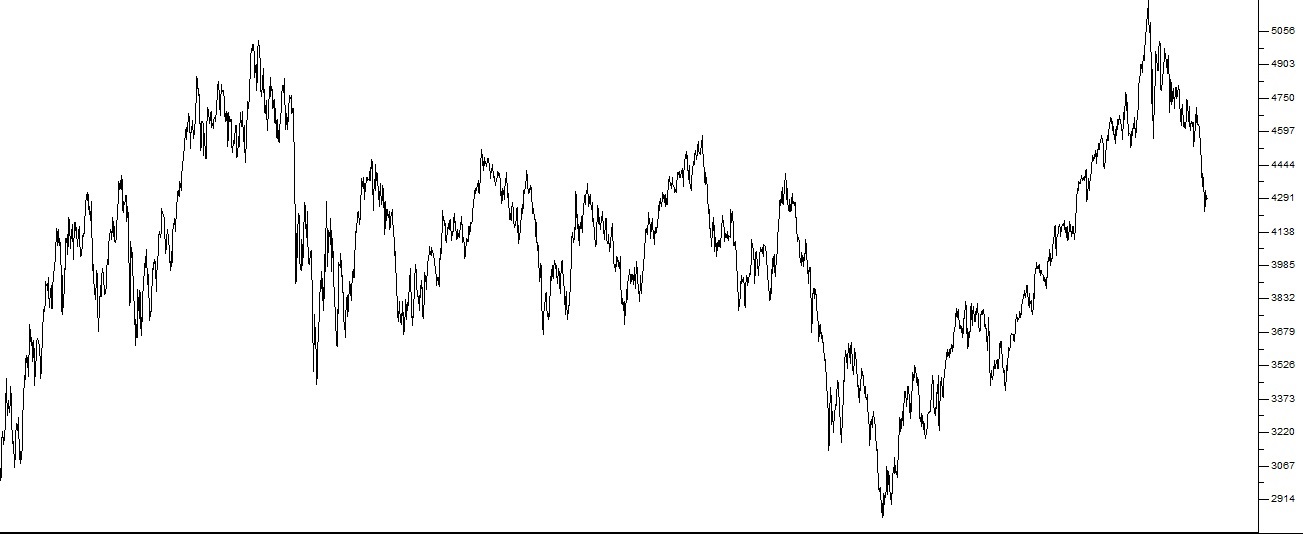
MSCI Index (i-MSCI) 2009 to 2018 - Chart by ShareFriend Pro
Of course, during this nine-year period the first world stock markets have been in a protracted bull trend, so you can immediately see that emerging stock markets have been much more volatile � and have moved basically sideways. It is also interesting to use a comparative relative strength (CRSI) chart to compare the JSE Overall index with the MSCI. The CRSI chart simply divides one data stream (like the JSE overall) by another (like the MSCI) and draws a graph of the result. Consider the chart: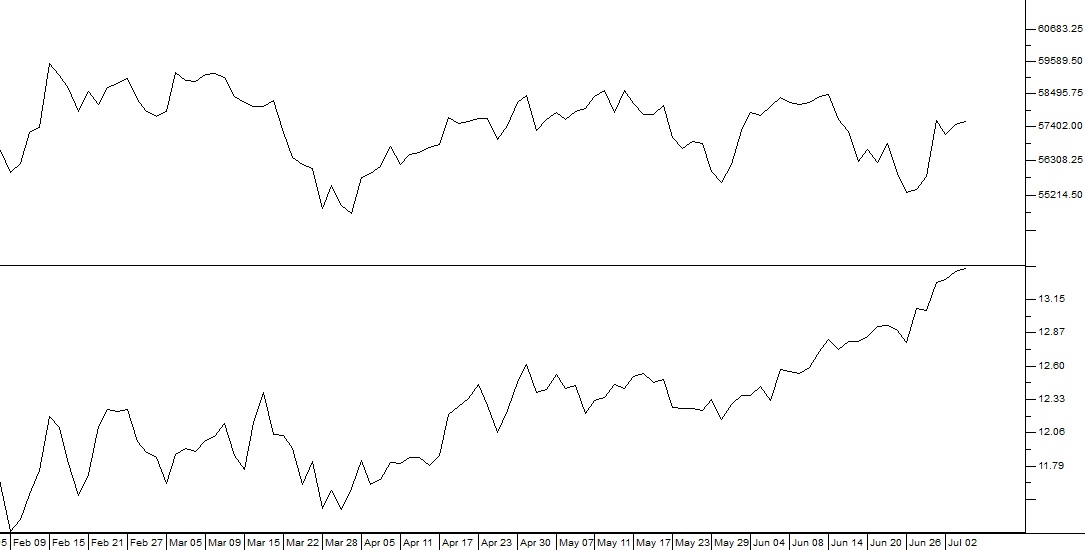
Comparative Relative Strength Index of the MSCI index and the JSE Overall Index February 2018 to July 2018 - Chart by ShareFriend Pro
This chart gives the JSE Overall in the top half and the CRSI against the MSCI in the bottom half. You can see immediately that, even though the JSE Overall has been in a downward trend since February, it has been out-performing the MSCI. In other words, South Africa has been one of the least badly affected countries among the emerging economies by the current �risk-off� attitude of international investors. This, in turn, means that when international investment sentiment moves back to being �risk-on� we will benefit more than the other emerging economies. So the risk-off sentiment which currently dominates has caused a major sell off of our bonds and shares. In May month alone the JSE has seen a net R20bn worth of shares sold and our bond market lost R30bn. That has caused many of our higher quality shares to be depressed � for reasons which are really nothing to do with South Africa. We believe that the risk perception cycle is about to turn which means that money will flow back into our leading shares. That implies that the current sell-off represents a buying opportunity for private investors in South Africa.DISCLAIMER
All information and data contained within the PDSnet Articles is for informational purposes only. PDSnet makes no representations as to the accuracy, completeness, suitability, or validity, of any information, and shall not be liable for any errors, omissions, or any losses, injuries, or damages arising from its display or use. Information in the PDSnet Articles are based on the author’s opinion and experience and should not be considered professional financial investment advice. The ideas and strategies should never be used without first assessing your own personal and financial situation, or without consulting a financial professional. Thoughts and opinions will also change from time to time as more information is accumulated. PDSnet reserves the right to delete any comment or opinion for any reason.
Share this article: