Learning from Steinhoff
10 May 2019 By PDSNETThe Steinhoff debacle, which really came to an end on Wednesday when they published their re-stated financial results for the 2017 year (reported in Business Day of 9th May 2019), contains some vital lessons for private investors.
The financials reveal a web of companies which were used by a group of unscrupulous executives to move money around, overstate profits and obscure fraudulent transactions.
Clearly, the investing public and even the highly-qualified and experienced analysts at various asset management companies like Coronation, Allan Gray and the Public Investment Corporation (PIC) were fooled into thinking that Steinhoff was a solid blue chip company which was growing rapidly.
Steinhoff’s financial results were analysed exhaustively. Steinhoff executives were interviewed and questioned about various aspects of the business. Auditors did numerous spot checks of the figures and wrote clean audit reports. Nobody realized until it was too late that the structure and the published results were just “smoke and mirrors”.
How can a private investor with limited time and resources protect himself against this type of cataclysm?
The answer lies in the charts.
Every company has insiders who will always know more about what is really happening than you can. Those insiders will always trade on their superior knowledge before the facts are revealed to the public. Their trades will impact the share’s chart in specific ways which are clearly visible to the alert investor.
Let us consider the example of Steinhoff and what its chart revealed long before its ultimate collapse:
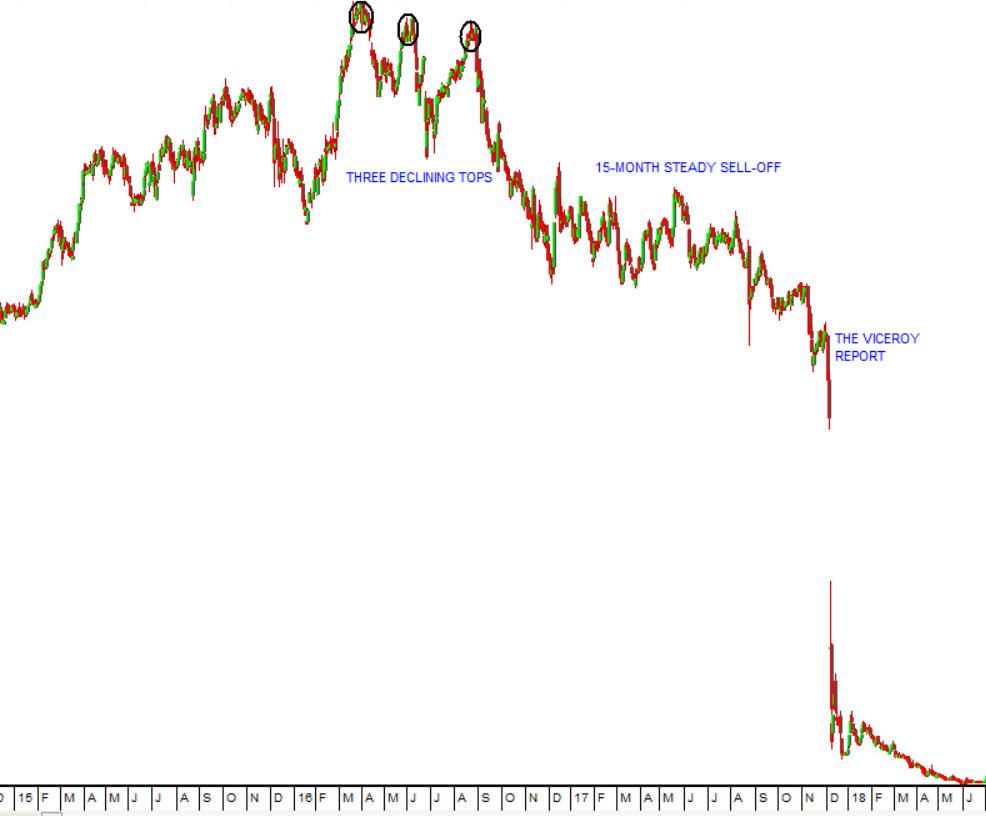
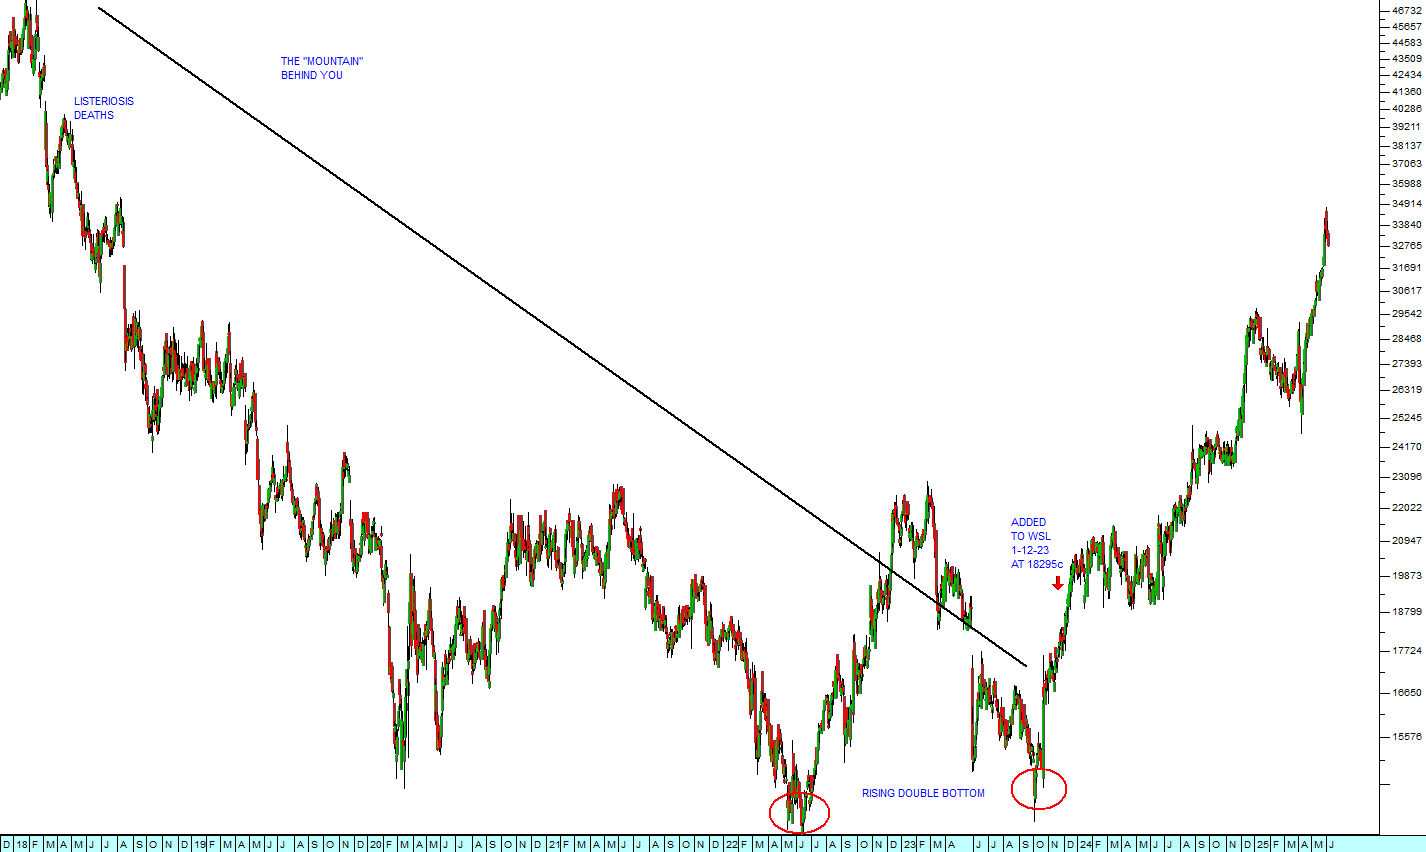
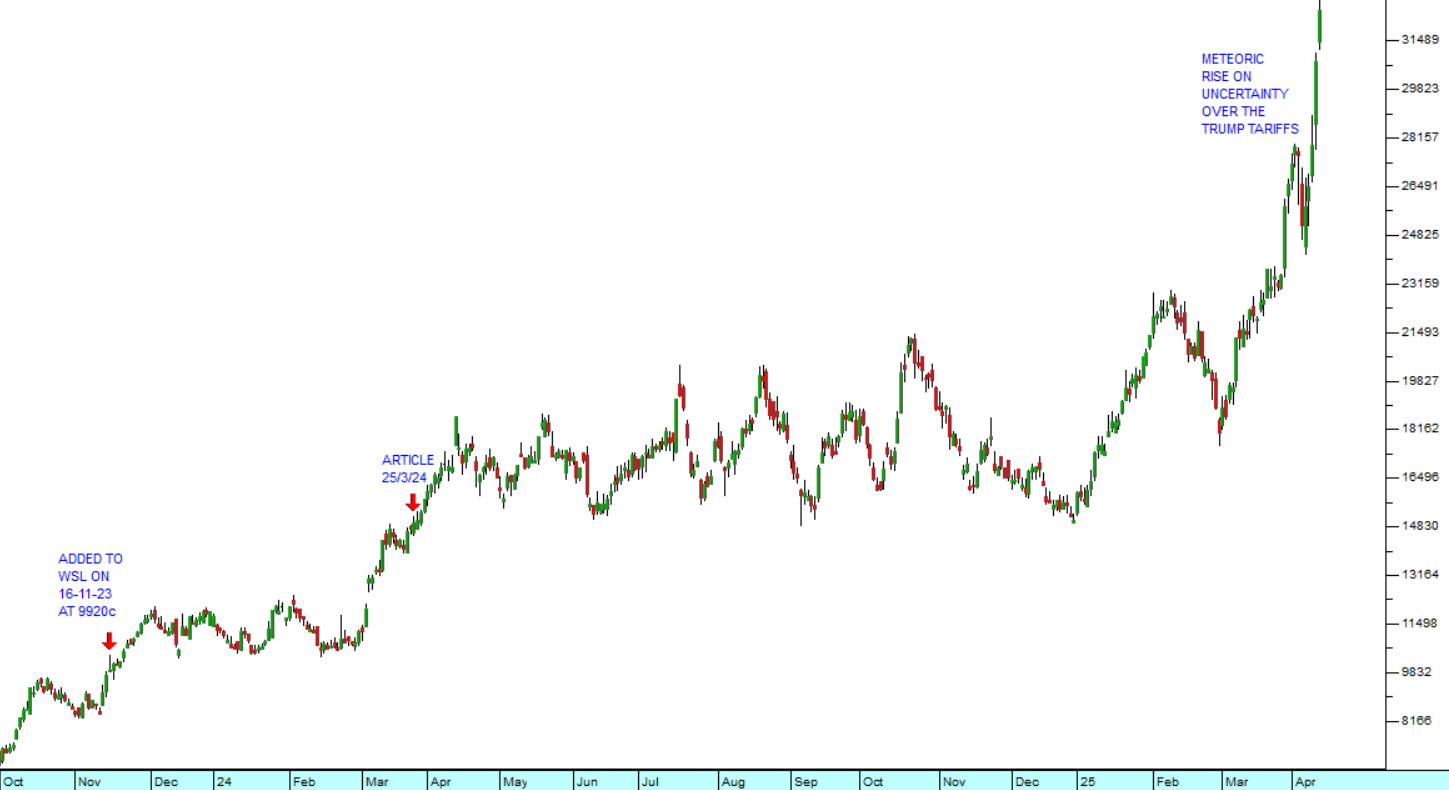
You can see here the meteoric rise of Steinhoff until March 2016 when its share reached a peak of 9685c. The share was a “market darling” and everyone was buying it – especially the big institutional investors.
Then something happened which should have alerted anyone who was watching the progress of Steinhoff’s upward trend. It made a “lower top” at 9479c on 7th June 2016. The share went up and attempted to exceed its March 2016 high – and then failed. This failure was followed (as it usually is) by some disappointment and the share fell back to lower levels.
Then in August 2016, investors built up their courage to try again. But this time the share could only reach 9360c before it fell back. A second failure created a declining “triple top”. This is probably one of the most negative and bearish of all technical formations in charting. Anyone who was the least acquainted with the basic principles of charting would have been aware that Steinhoff was about to fall – and so it did.
But fund managers are stubbornly loyal to the idea that audited financials are reliable indicators of a company’s future performance. Indeed their entire training leads them to be so. But somebody inside Steinhoff already knew the truth and was busy off-loading a substantial portfolio of shares. Whenever the share reached high levels above 9000c that insider sold off another large chunk of shares – which were enthusiastically taken up – mostly by institutional investors.
There followed a period of about 15 months during which the share drifted down before the publication of the Viceroy report, the acknowledgement of “accounting irregularities”, and the resignation of Marcus Jooste as CEO brought the illusion to an abrupt end. The share collapsed from 5500c to less than 500c.
A person familiar with technical analysis will notice that after this third lower top, the share broke down through its long-term upward trendline – a clear sell signal. They would also have noticed that a massive long-term “head-and-shoulders” formation was becoming apparent.
This formation consists of a “right shoulder”, “head” and “left shoulder” and the low points which follow the right shoulder and the head can be connected to draw a “neckline”. Conventional technical wisdom is that a break below the neckline is the final signal of the coming bear trend. This break occurred on 10th November 2017 – when Steinhoff was trading for 5600c. Shortly after that it collapsed by more than 90%.
You should take your time to study exactly what happened to Steinhoff and how you, as a private investor, could have avoided being a victim.
DISCLAIMER
All information and data contained within the PDSnet Articles is for informational purposes only. PDSnet makes no representations as to the accuracy, completeness, suitability, or validity, of any information, and shall not be liable for any errors, omissions, or any losses, injuries, or damages arising from its display or use. Information in the PDSnet Articles are based on the author’s opinion and experience and should not be considered professional financial investment advice. The ideas and strategies should never be used without first assessing your own personal and financial situation, or without consulting a financial professional. Thoughts and opinions will also change from time to time as more information is accumulated. PDSnet reserves the right to delete any comment or opinion for any reason.
Share this article: