Excessive Bullishness
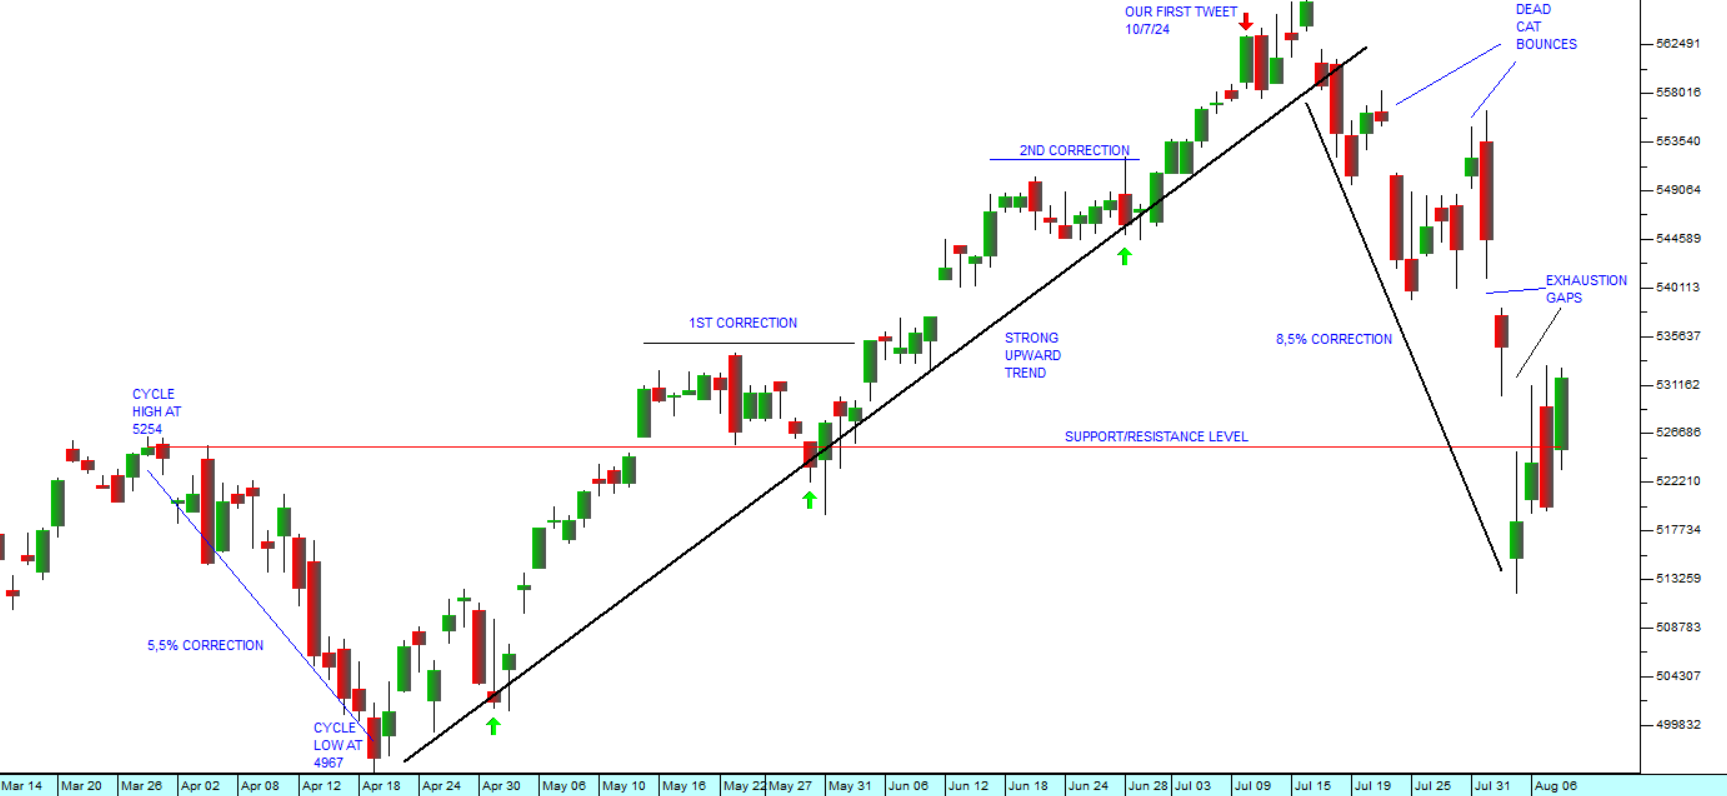
26 February 2024 By PDSNETOn Friday last week, the S&P500 index posted yet another new record closing high, but this time just one point higher than the previous day at 5088. This means that the index, which measures the progress of the 500 largest companies on Wall Street, has been climbing without a significant correction for nearly four months. Consider the chart:
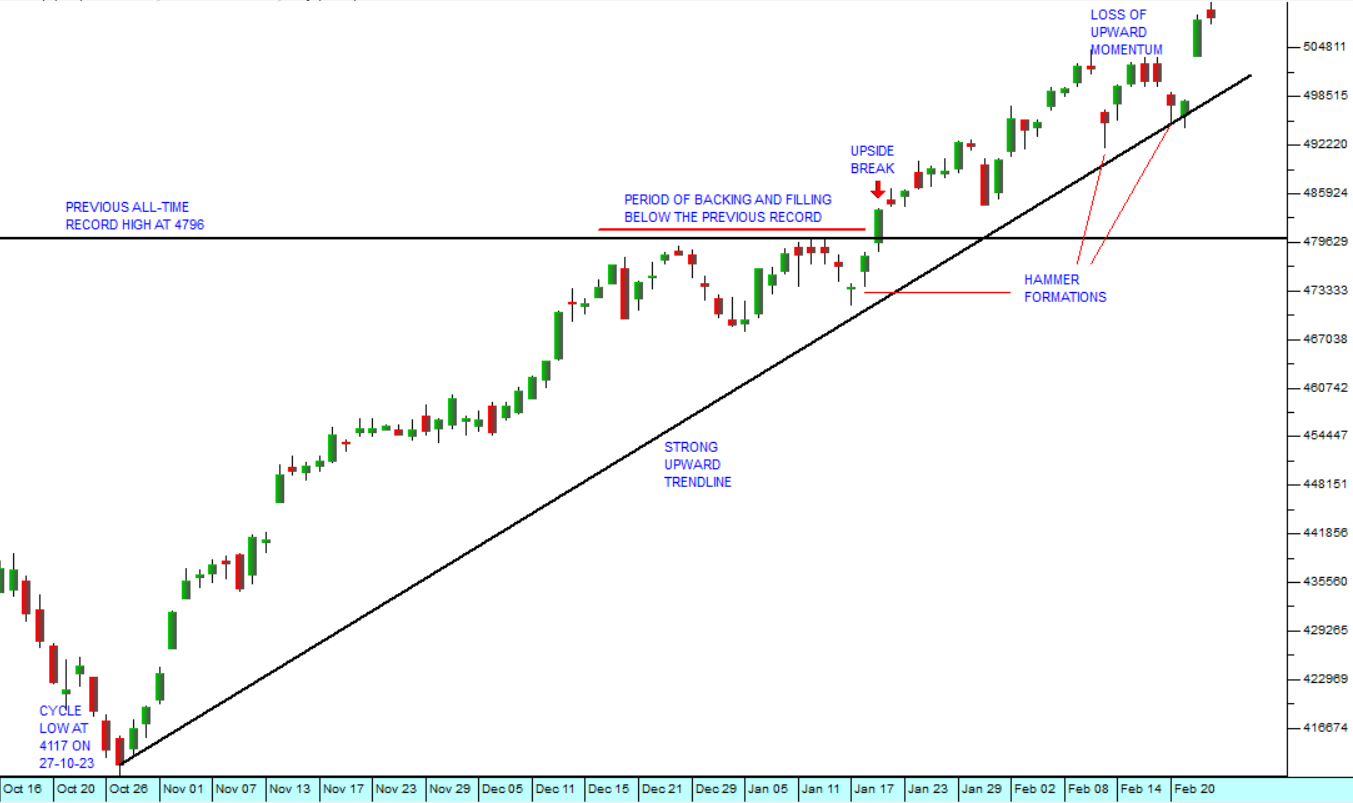
The chart shows the previous cycle low at 4117 which happened on the 27th of October 2023. Then in late December of 2023 and early January of 2024 there was a period of “backing and filling,” just below the previous cycle high at 4796. The upside break came on the 19th of January when the index broke decisively up through that resistance to a new all-time record high.
The resistant effect of any long-standing previous cycle high, like this one, is shown by the initial difficulty which the index experienced in breaking above it. This is very typical. Any previous all-time record high, which has been standing for a long time, can be expected to arrest upward momentum and sometimes even to stop it completely (resulting in a “double top”). This type of resistance can also be seen at large round numbers – as in this case the index level of 5000 which proved to be a temporary psychological barrier. Once that barrier was convincingly penetrated there was a surge of buying exuberance which took the market up even further.
However, nothing in the market moves in a straight line. And this market is definitely long overdue for a significant correction. The regular appearance of corrections is probably one of the most reliable and consistent maxims of technical analysis. When there has not been a correction for an extended period of time, as is the case now, then it is a clear indication of excessive bullishness in the underlying market.
Investors have literally become over-excited by the strong upward momentum together with the penetration of major barriers like the 5000 level and the 4796 level. To the bulls, the upward momentum is beginning to be seen as a “new normal”.
Of course, it is always difficult to predict exactly when a correction will occur, and this market could certainly go higher - but experienced technicians become increasingly nervous when faced with such a long period of upward movement. The smart money begins taking profits and making it difficult for the bulls to take the market even higher. This causes a loss of upward momentum, which often presages a downward trend.
On the fundamental front, the S&P500 has been buoyed by the good results coming out of hi-tech companies, most notably Nvidia’s recent results for the 4th quarter of 2023. The company posted revenue of $22,1bn – which was 22% above the 3rd quarter and up 265% from a year ago. Nvidia produces a chip which is specifically designed for artificial intelligence (AI) systems. The CEO, Jensen Huang, said, “Accelerated computing and generative AI have hit the tipping point. Demand is surging worldwide across companies, industries and nations.”
The current situation is similar in many ways to that which occurred in the 1920’s when the widespread use of telephones, mass-produced motor vehicles and the spread of railways had an enormous nation-wide impact on productivity leading to a stock market boom. AI is a development which is potentially impacting the productivity and profitability of almost all companies.
But we say again, nothing in the markets moves in a straight line. Some sort of correction is inevitable, sooner or later.
DISCLAIMER
All information and data contained within the PDSnet Articles is for informational purposes only. PDSnet makes no representations as to the accuracy, completeness, suitability, or validity, of any information, and shall not be liable for any errors, omissions, or any losses, injuries, or damages arising from its display or use. Information in the PDSnet Articles are based on the author’s opinion and experience and should not be considered professional financial investment advice. The ideas and strategies should never be used without first assessing your own personal and financial situation, or without consulting a financial professional. Thoughts and opinions will also change from time to time as more information is accumulated. PDSnet reserves the right to delete any comment or opinion for any reason.
Share this article: