VOLUME
12 May 2016 By PDSNETThe number of shares changing hands during a single trading day. This figure is calculated by counting the number of shares traded in a particular security daily, which gives the daily traded volume you can see on the price page of your daily newspaper and in the volume histogram at the bottom of your chart in your software. You should keep a careful lookout for exceptional or unusual volumes on a share, because that can give a clue to possible special situations developing. You can also see the exact number of shares which changed hands if the volume histogram is on. Your software has various indicators which make use of the daily volume traded - like the Volume Oscillator, the Volume ROC and the On Balance Volume (OBV). Consider the following chart of Hulamin (HLM):
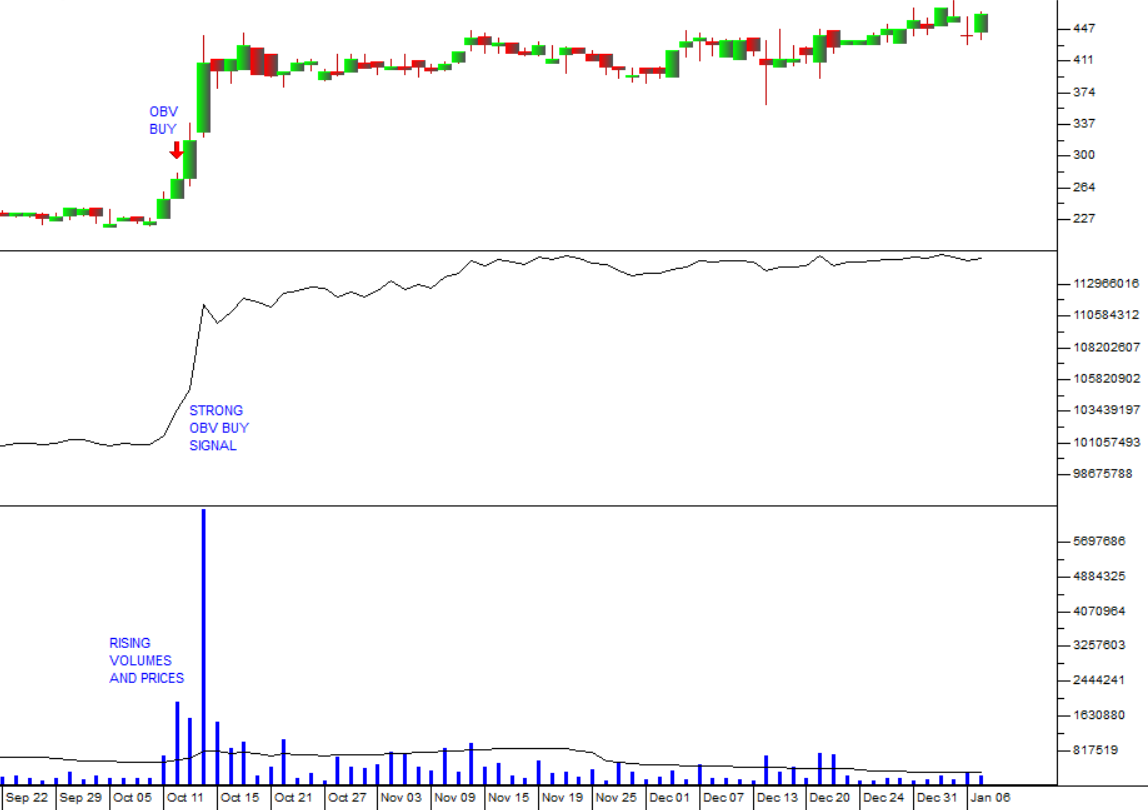
Hulamin: 22 September 2021 - 6 January 2022. Chart by ShareFriend Pro.
You can see here that in October 2021, volumes in the share began to rise with small increments in price resulting in a strong OBV buy signal on 12th October 2021 when the price was 274c. The share subsequently moved up to trade at over 400c and at the start of 2022 was trading as high as 467c.
Share this glossary term: