SUPPORT
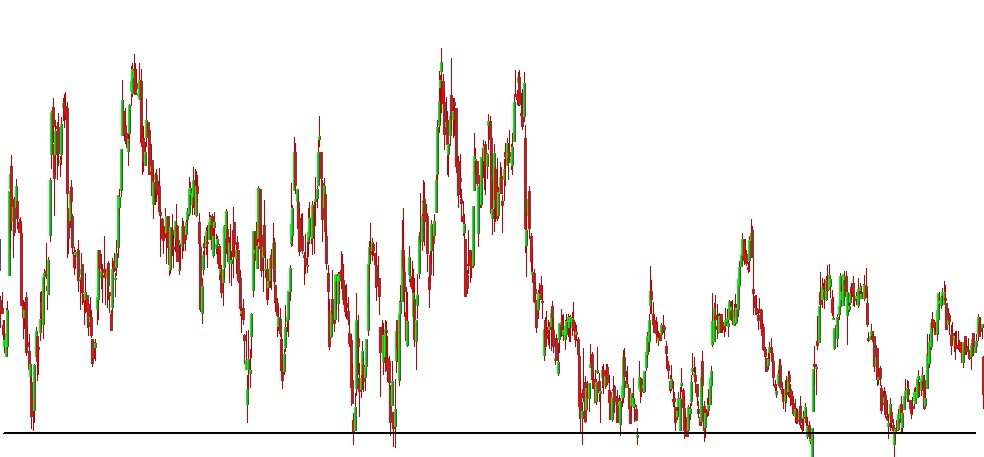
31 May 2016 By PDSNETA historical price level at which falling prices have stopped falling and either moved sideways or reversed direction; usually seen as a price chart pattern. Large investors have placed set orders with their stockbrokers to buy whenever the price reaches that level – which means that the chart will keep bouncing off that level until the sell orders are exhausted or a new upward trend begins.
Share this glossary term: